600
Views
6
CrossRef citations to date
0
Altmetric
Research Article

Histamine protects against the acute phase of experimentally-induced hepatic ischemia/re-perfusion

, , &
Pages 9-16 | Received 27 Dec 2011, Accepted 04 Apr 2012, Published online: 13 Jul 2012

Figures & data

Figure 1.  Effects of histaminergic ligands on hepatic lipid peroxides contents (measured as MDA). Rats were subjected to either sham operation or hepatic ischemia followed by re-perfusion. I/R-operated rats were pre-treated three times (at 24, 12, and 0 h) before induction of ischemia with control vehicle(s), histamine (20 mg/kg, SC), mepyramine (3 mg/kg, SC 15 min prior to histamine), ranitidine (10 mg/kg, SC 15 min prior to histamine), thioperamide (5 mg/kg, SC 15 min prior to histamine), or clozapine (15 mg/kg, SC). Hepatic lipid peroxides contents (i.e., MDA) were determined at the end of the re-perfusion period. Data are presented as mean (± SD; n = 8/group) MDA content (µM/g tissue). Value is significantly different from the * sham-operated, a I/R, or b histamine group at p < 0.05. H, histamine; M, mepyramine; R, ranitidine; T, thioperamide; Cloz, clozapine.
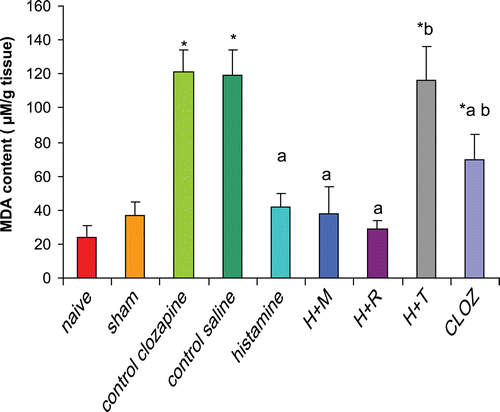
Figure 1.  Effects of histaminergic ligands on hepatic lipid peroxides contents (measured as MDA). Rats were subjected to either sham operation or hepatic ischemia followed by re-perfusion. I/R-operated rats were pre-treated three times (at 24, 12, and 0 h) before induction of ischemia with control vehicle(s), histamine (20 mg/kg, SC), mepyramine (3 mg/kg, SC 15 min prior to histamine), ranitidine (10 mg/kg, SC 15 min prior to histamine), thioperamide (5 mg/kg, SC 15 min prior to histamine), or clozapine (15 mg/kg, SC). Hepatic lipid peroxides contents (i.e., MDA) were determined at the end of the re-perfusion period. Data are presented as mean (± SD; n = 8/group) MDA content (µM/g tissue). Value is significantly different from the * sham-operated, a I/R, or b histamine group at p < 0.05. H, histamine; M, mepyramine; R, ranitidine; T, thioperamide; Cloz, clozapine.
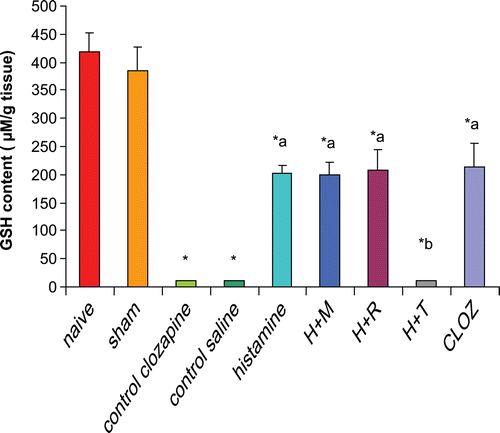
Figure 2.  Effects of histaminergic ligands on hepatic GSH contents. Rats were subjected to either sham operation or hepatic ischemia followed by re-perfusion. I/R-operated rats were pre-treated three times (at 24, 12, and 0 h) before induction of ischemia with control vehicles, histamine, mepyramine, ranitidine, thioperamide, or clozapine. For doses/timing of doses, please see legend to . Hepatic GSH contents were determined at the end of the re-perfusion period. Data are presented as mean (± SD; n = 8/group) GSH content (µM/g tissue). Value is significantly different from the * sham-operated, a I/R, or b histamine group at p < 0.05. H, histamine; M, mepyramine; R, ranitidine; T, thioperamide; Cloz, clozapine.
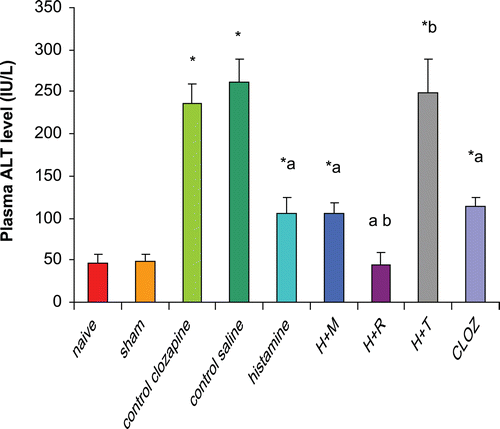
Figure 2.  Effects of histaminergic ligands on hepatic GSH contents. Rats were subjected to either sham operation or hepatic ischemia followed by re-perfusion. I/R-operated rats were pre-treated three times (at 24, 12, and 0 h) before induction of ischemia with control vehicles, histamine, mepyramine, ranitidine, thioperamide, or clozapine. For doses/timing of doses, please see legend to Figure 1. Hepatic GSH contents were determined at the end of the re-perfusion period. Data are presented as mean (± SD; n = 8/group) GSH content (µM/g tissue). Value is significantly different from the * sham-operated, a I/R, or b histamine group at p < 0.05. H, histamine; M, mepyramine; R, ranitidine; T, thioperamide; Cloz, clozapine.
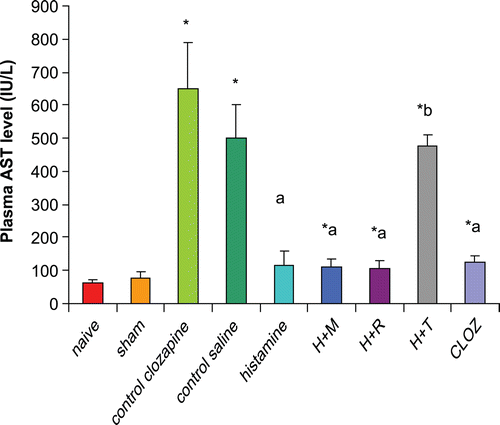
Figure 3.  Effects of histaminergic ligands on plasma ALT level. Rats were subjected to either sham operation or hepatic ischemia followed by re-perfusion. I/R-operated rats were pre-treated three times (at 24, 12, and 0 h) before induction of ischemia with control vehicles, histamine, mepyramine, ranitidine, thioperamide, or clozapine. For doses/timing of doses, please see legend to . Plasma ALT levels were determined at the end of the re-perfusion period. Data are presented as the mean (± SD; n = 8/group) ALT levels (IU/L). Value is significantly different from the * sham-operated, a I/R, or b histamine group at p < 0.05. H, histamine; M, mepyramine; R, ranitidine; T, thioperamide; Cloz, clozapine.
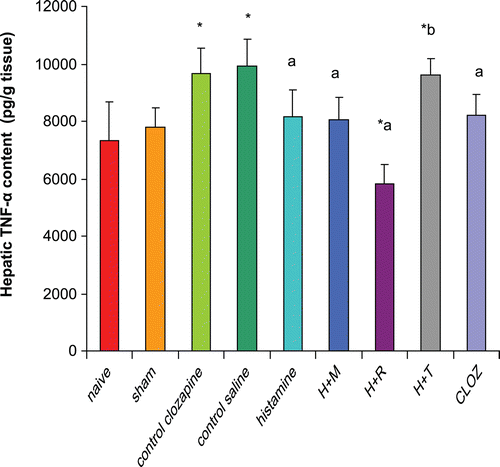
Figure 3.  Effects of histaminergic ligands on plasma ALT level. Rats were subjected to either sham operation or hepatic ischemia followed by re-perfusion. I/R-operated rats were pre-treated three times (at 24, 12, and 0 h) before induction of ischemia with control vehicles, histamine, mepyramine, ranitidine, thioperamide, or clozapine. For doses/timing of doses, please see legend to Figure 1. Plasma ALT levels were determined at the end of the re-perfusion period. Data are presented as the mean (± SD; n = 8/group) ALT levels (IU/L). Value is significantly different from the * sham-operated, a I/R, or b histamine group at p < 0.05. H, histamine; M, mepyramine; R, ranitidine; T, thioperamide; Cloz, clozapine.
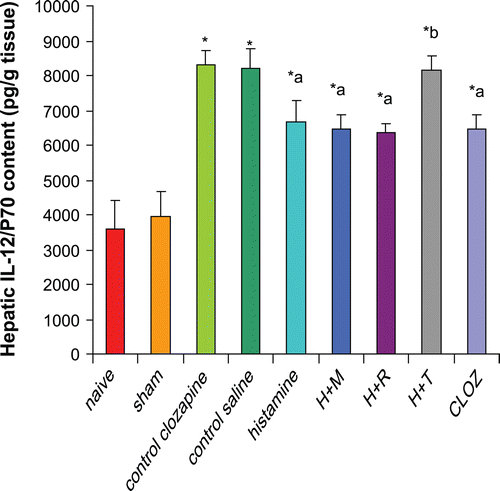
Figure 4.  Effects of histaminergic ligands on plasma AST level. Rats were subjected to either sham operation or hepatic ischemia followed by re-perfusion. I/R-operated rats were pre-treated 3-times (at 24, 12, and 0 h) before induction of ischemia with control vehicles, histamine, mepyramine, ranitidine, thioperamide, or clozapine. For doses/timing of doses, please see legend to . Plasma AST levels were determined at the end of the re-perfusion period. Data are presented as the mean (± SD; n = 8/group) AST levels (IU/L). Value is significantly different from the * sham-operated, a I/R, or b histamine group at p < 0.05. H, histamine; M, mepyramine; R, ranitidine; T, thioperamide; Cloz, clozapine.

Figure 4.  Effects of histaminergic ligands on plasma AST level. Rats were subjected to either sham operation or hepatic ischemia followed by re-perfusion. I/R-operated rats were pre-treated 3-times (at 24, 12, and 0 h) before induction of ischemia with control vehicles, histamine, mepyramine, ranitidine, thioperamide, or clozapine. For doses/timing of doses, please see legend to Figure 1. Plasma AST levels were determined at the end of the re-perfusion period. Data are presented as the mean (± SD; n = 8/group) AST levels (IU/L). Value is significantly different from the * sham-operated, a I/R, or b histamine group at p < 0.05. H, histamine; M, mepyramine; R, ranitidine; T, thioperamide; Cloz, clozapine.

Figure 5.  Effects of histaminergic ligands on TNFα contents. Rats were subjected to either sham operation or hepatic ischemia followed by re-perfusion. I/R-operated rats were pre-treated 3-times (at 24, 12, and 0 h) before induction of ischemia with control vehicles, histamine, mepyramine, ranitidine, thioperamide, or clozapine. For doses/timing of doses, please see legend to . Hepatic TNFα contents were determined at the end of the re-perfusion period. Data are presented as the mean (± SD; n = 8/group) TNFα content (pg/g tissue). Value is significantly different from the * sham-operated, a I/R, or b histamine group at p < 0.05. H, histamine; M, mepyramine; R, ranitidine; T, thioperamide; Cloz, clozapine.

Figure 5.  Effects of histaminergic ligands on TNFα contents. Rats were subjected to either sham operation or hepatic ischemia followed by re-perfusion. I/R-operated rats were pre-treated 3-times (at 24, 12, and 0 h) before induction of ischemia with control vehicles, histamine, mepyramine, ranitidine, thioperamide, or clozapine. For doses/timing of doses, please see legend to Figure 1. Hepatic TNFα contents were determined at the end of the re-perfusion period. Data are presented as the mean (± SD; n = 8/group) TNFα content (pg/g tissue). Value is significantly different from the * sham-operated, a I/R, or b histamine group at p < 0.05. H, histamine; M, mepyramine; R, ranitidine; T, thioperamide; Cloz, clozapine.

Figure 6.  Effects of histaminergic ligands on IL-12 (p70). Rats were subjected to either sham operation or hepatic ischemia followed by re-perfusion. I/R-operated rats were pre-treated 3-times (at 24, 12, and 0 h) before induction of ischemia with control vehicles, histamine (20 mg/kg, SC), mepyramine (3 mg/kg, SC) 15 min prior to histamine, ranitidine (10 mg/kg, SC) 15 min prior to histamine, thioperamide (5 mg/kg, SC) 15 min prior to histamine or clozapine (15 mg/kg, SC). Hepatic IL-12 (p70) contents were determined at the end of the re-perfusion period. Data are presented as the mean (± SD; n = 8/group) Hepatic IL-12 (p70) contents (pg/g tissue). Value is significantly different from the * sham-operated, a I/R, or b histamine group at p < 0.05. H, histamine; M, mepyramine; R, ranitidine; T, thioperamide; Cloz, clozapine.

Figure 6.  Effects of histaminergic ligands on IL-12 (p70). Rats were subjected to either sham operation or hepatic ischemia followed by re-perfusion. I/R-operated rats were pre-treated 3-times (at 24, 12, and 0 h) before induction of ischemia with control vehicles, histamine (20 mg/kg, SC), mepyramine (3 mg/kg, SC) 15 min prior to histamine, ranitidine (10 mg/kg, SC) 15 min prior to histamine, thioperamide (5 mg/kg, SC) 15 min prior to histamine or clozapine (15 mg/kg, SC). Hepatic IL-12 (p70) contents were determined at the end of the re-perfusion period. Data are presented as the mean (± SD; n = 8/group) Hepatic IL-12 (p70) contents (pg/g tissue). Value is significantly different from the * sham-operated, a I/R, or b histamine group at p < 0.05. H, histamine; M, mepyramine; R, ranitidine; T, thioperamide; Cloz, clozapine.

Figure 7.  Histology of liver sections recovered from rats in the various treatment groups. All images are 250× magnifications of H&E-stained tissues and are representative of samples from rats in each group. Section from: (a) sham-operated rat showing apparently normal liver except for mild central venous dilatation and congestion; (b) I/R-operated rat (control) showing disturbed architecture with necrosis and vacuolar degeneration around a dilated congested central vein; (c) histamine pre-treated rat showing minimal vacuolar degeneration peripherally; (d) rat that received thioperamide prior to histamine, showing massive central zonal necrosis around a dilated, engorged central vein with variable degrees of vacuolar degeneration; and (e) clozapine pre-treated rat showing mild vacuolar degeneration in hepatocytes and a dilated central vein.
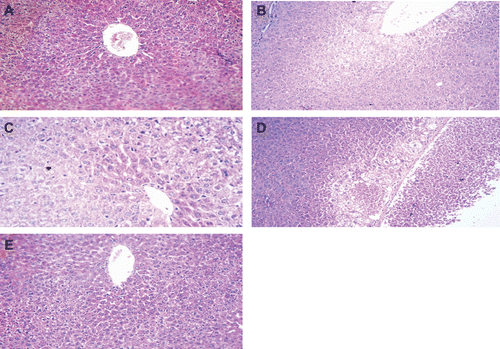
Figure 7.  Histology of liver sections recovered from rats in the various treatment groups. All images are 250× magnifications of H&E-stained tissues and are representative of samples from rats in each group. Section from: (a) sham-operated rat showing apparently normal liver except for mild central venous dilatation and congestion; (b) I/R-operated rat (control) showing disturbed architecture with necrosis and vacuolar degeneration around a dilated congested central vein; (c) histamine pre-treated rat showing minimal vacuolar degeneration peripherally; (d) rat that received thioperamide prior to histamine, showing massive central zonal necrosis around a dilated, engorged central vein with variable degrees of vacuolar degeneration; and (e) clozapine pre-treated rat showing mild vacuolar degeneration in hepatocytes and a dilated central vein.

Reprints and Corporate Permissions

Please note: Selecting permissions does not provide access to the full text of the article, please see our help page How do I view content?

To request a reprint or corporate permissions for this article, please click on the relevant link below:

Academic Permissions

Please note: Selecting permissions does not provide access to the full text of the article, please see our help page How do I view content?

Obtain permissions instantly via Rightslink by clicking on the button below:

If you are unable to obtain permissions via Rightslink, please complete and submit this Permissions form. For more information, please visit our Permissions help page.