Figures & data
Figure 1. Anti-coagulant effects of oral warfarin intake. Prothrombin (PT) and partial thromboplastin time (PTT) were determined in rat blood collected at 0, 7, 15, and 30 days following warfarin (3.5 mg/L) consumption. Data are presented as mean ± SD from at least two independent experiments, with 4–6 rats/timepoint/treatment. Value significantly different from control (warfarin intake duration = 0 days) at **p < 0.01 or ***p < 0.001.
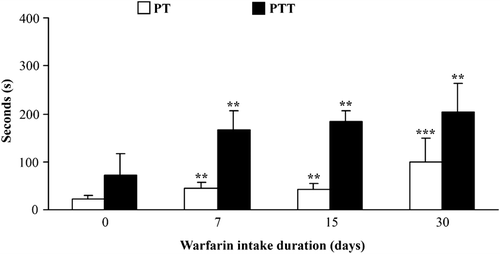
Table 1. Total and differential peripheral blood cell counts in rat that consumed warfarin.
Figure 2. Histology of lungs of rats that consumed warfarin. Representative samples from treated and control rats after 30 days of exposure. (a) Widened lung interstitium. Lungs of control rats are shown in insert. (b) Margination and transendothelial migration of neutrophils (arrows). (c) Neutrophils in interstitium (arrows). (d) Fresh erythrocytes and liquid in alveoli.
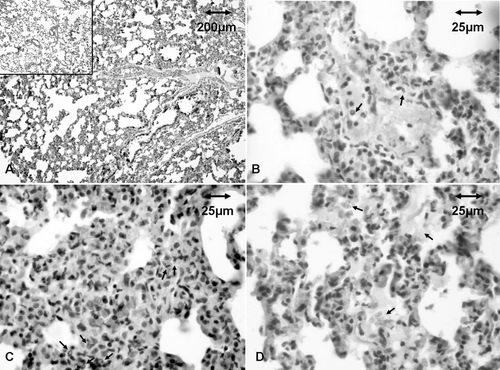
Figure 3. Effect of warfarin intake on peripheral blood leukocyte TNFα production and expression. Spontaneous (LPS, 0 ng/ml) and stimulated (100 ng LPS/ml) TNFα production was analyzed in conditioned medium of (a) mononuclear and (b) polymorphonuclear cells isolated from peripheral blood of rats that did not consume warfarin (control, warfarin intake duration = 0 days) and rats that consumed warfarin (3.5 mg/L) for 7, 15, or 30 days. (c) TNFα mRNA expression was analyzed in both cell types isolated from rat blood 0 and 30 days after start of warfarin consumption. Data are presented as mean ± SD (for cytokine production) and mean ± SE (for mRNA expression) from two independent experiments, with 4–6 rats/timepoint/treatment. Value significantly different from control (warfarin intake duration = 0 days) at *p < 0.05 or **p < 0.01.
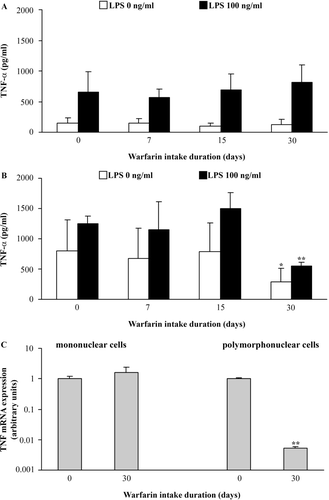
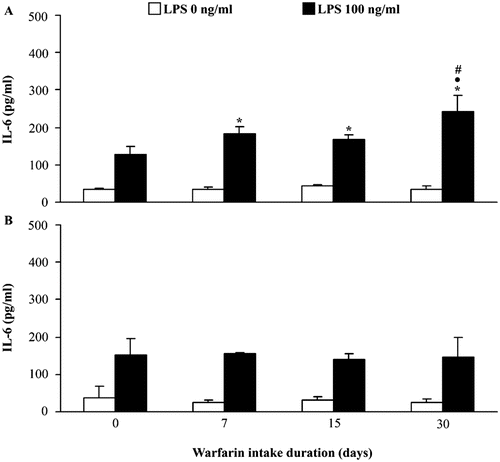
Figure 4. Effect of warfarin intake on peripheral blood leukocyte IL-6 production and expression. Spontaneous (LPS 0 ng/ml) and stimulated (100 ng LPS/ml) IL-6 production was analyzed in conditioned medium of (a) mononuclear and (b) polymorphonuclear cells isolated from peripheral blood of rats that did not consume warfarin (control, warfarin intake duration = 0 days) and rats that consumed warfarin (3.5 mg/L) for 7, 15, or 30 days. Data are presented as mean ± SD from at least two independent experiments, with 4–6 rats/timepoint/treatment. Value significantly different from: control (warfarin intake duration = 0 days) (*p < 0.05); values for warfarin intake duration = 7 days (• p < 0.05), and values for warfarin intake duration = 15 days (# p < 0.05).