881
Views
12
CrossRef citations to date
0
Altmetric
Research Article

Role of AP-1 family proteins in regulation of inducible nitric oxide synthase (iNOS) in human neutrophils

, , , , &
Pages 32-39 | Received 26 Jan 2012, Accepted 17 Apr 2012, Published online: 26 Jun 2012

Figures & data

Figure 1.  Northern blot analysis for the expression of iNOS mRNA in human PMN. Cells were treated with 0.74 µg NDMA/µl for 2 h. Total RNA (10 µg/sample from 107 total cells) were then size-fractioned by agarose gel electrophoresis and transferred onto a positively-charged nylon membrane. Detection of iNOS mRNA or β-actin mRNA was performed using oligonucleotide probes labeled with biotin. Hybridization was followed by chemiluminescent detection of hybrids and analyzed using ImageJ software. Similar results were obtained from 10 independent experiments; one representative blot is shown.
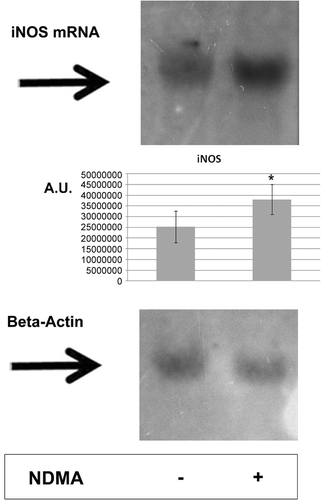
Figure 1.  Northern blot analysis for the expression of iNOS mRNA in human PMN. Cells were treated with 0.74 µg NDMA/µl for 2 h. Total RNA (10 µg/sample from 107 total cells) were then size-fractioned by agarose gel electrophoresis and transferred onto a positively-charged nylon membrane. Detection of iNOS mRNA or β-actin mRNA was performed using oligonucleotide probes labeled with biotin. Hybridization was followed by chemiluminescent detection of hybrids and analyzed using ImageJ software. Similar results were obtained from 10 independent experiments; one representative blot is shown.

Figure 2.  Expression of iNOS, Fra-1, Fra-2, JunB, JunD, and FosB in PMN. (A) PMN were treated with or without SB203580 (40 µM), BIX02189 (30 µM), or SP600125 (40 µM) for 1 h before addition of NDMA (0.74 µg/µl). The cytoplasmic and nuclear fractions obtained from the cells were used to detect iNOS, Fra-1, Fra-2, JunB, JunD, and FosB protein levels by Western blot. The results shown are representative of five independent experiments. (B) Band intensity was quantified using ImageJ software and expressed in arbitrary units (AU). Data shown are mean (± SE) of five independent experiments. * Value significantly different between cells without and with NDMA (p < 0.05); #value significantly different between cells treated with NDMA but pre-incubated without or with the inhibitor (p < 0.05).
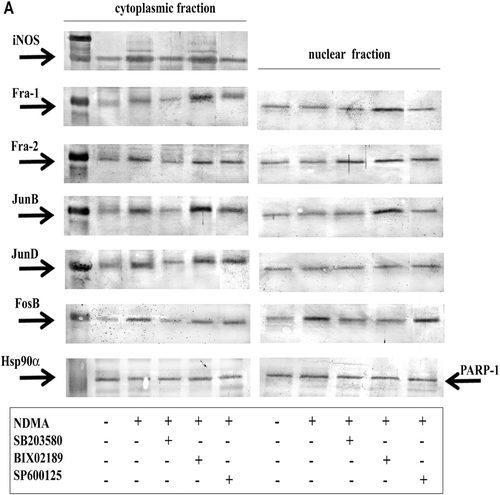
Figure 2.  Expression of iNOS, Fra-1, Fra-2, JunB, JunD, and FosB in PMN. (A) PMN were treated with or without SB203580 (40 µM), BIX02189 (30 µM), or SP600125 (40 µM) for 1 h before addition of NDMA (0.74 µg/µl). The cytoplasmic and nuclear fractions obtained from the cells were used to detect iNOS, Fra-1, Fra-2, JunB, JunD, and FosB protein levels by Western blot. The results shown are representative of five independent experiments. (B) Band intensity was quantified using ImageJ software and expressed in arbitrary units (AU). Data shown are mean (± SE) of five independent experiments. * Value significantly different between cells without and with NDMA (p < 0.05); #value significantly different between cells treated with NDMA but pre-incubated without or with the inhibitor (p < 0.05).

Figure 3.  Concentrations of total NO from PMN. PMN were treated with or without SB203580 (40 µM), BIX02189 (30 µM), or SP600125 (40 µM) for 1 h before addition of NDMA (0.74 µg/µl). Two hours after addition of NDMA, the nitrite concentrations were measured as a marker of NO production. *Value significantly different between cells without and with NDMA (p < 0.05); #value significantly different between cells treated with NDMA but pre-incubated without or with the inhibitor (p < 0.05). Data are expressed as µM/106 cells (in 270 µl supernatant) and are shown as mean (± SE) of 20 experiments.
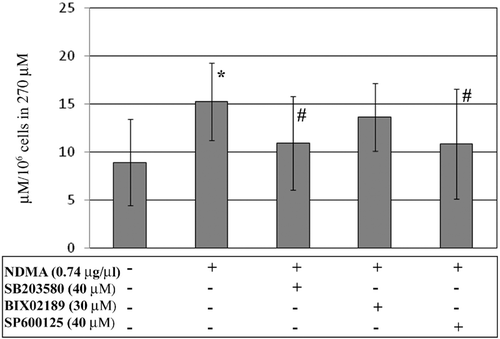
Figure 3.  Concentrations of total NO from PMN. PMN were treated with or without SB203580 (40 µM), BIX02189 (30 µM), or SP600125 (40 µM) for 1 h before addition of NDMA (0.74 µg/µl). Two hours after addition of NDMA, the nitrite concentrations were measured as a marker of NO production. *Value significantly different between cells without and with NDMA (p < 0.05); #value significantly different between cells treated with NDMA but pre-incubated without or with the inhibitor (p < 0.05). Data are expressed as µM/106 cells (in 270 µl supernatant) and are shown as mean (± SE) of 20 experiments.

Reprints and Corporate Permissions

Please note: Selecting permissions does not provide access to the full text of the article, please see our help page How do I view content?

To request a reprint or corporate permissions for this article, please click on the relevant link below:

Academic Permissions

Please note: Selecting permissions does not provide access to the full text of the article, please see our help page How do I view content?

Obtain permissions instantly via Rightslink by clicking on the button below:

If you are unable to obtain permissions via Rightslink, please complete and submit this Permissions form. For more information, please visit our Permissions help page.