1,077
Views
17
CrossRef citations to date
0
Altmetric
Research Article

A novel TH17-type cell is rapidly increased in the liver in response to acetaminophen-induced liver injury: TH17 cells and the innate immune response

&
Pages 287-291 | Received 25 Apr 2012, Accepted 23 Aug 2012, Published online: 08 Oct 2012

Figures & data

Figure 1.  Liver injury during APAP-induced liver toxicity. Balb/c mice were given saline or APAP (300 mg/kg) once by IP injection. At 0, 2, 6, and 24 h post-injection, mice were euthanized, blood was collected, and serum levels of ALT then measured. Results shown are the mean (± SE) of four mice.
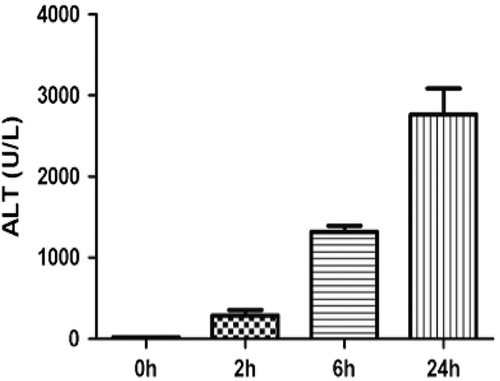
Figure 1.  Liver injury during APAP-induced liver toxicity. Balb/c mice were given saline or APAP (300 mg/kg) once by IP injection. At 0, 2, 6, and 24 h post-injection, mice were euthanized, blood was collected, and serum levels of ALT then measured. Results shown are the mean (± SE) of four mice.

Figure 2.  Serum IL-17 levels after APAP (300 mg/kg) treatment. Results shown are the mean (± SE) of four mice (** p < 0.01).
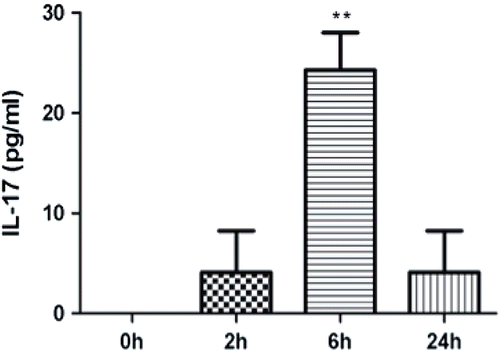
Figure 2.  Serum IL-17 levels after APAP (300 mg/kg) treatment. Results shown are the mean (± SE) of four mice (** p < 0.01).

Figure 3.  APAP treatment increased levels of IL-17-producing CD4+ T-cells in the liver after 2 h. (a) CD3 and CD4 double-positive cells were gated for further analysis. (b) Example of IL-17 expression compared between control and treatment animals; the x-axis is side scatter (SSC). (c) Percentage of CD4+IL-17+ T-cells in the liver 2 h after APAP treatment compared with controls. Results shown are the mean (± SE) from three mice. Similar results were obtained in three independent experiments (p < 0.03).
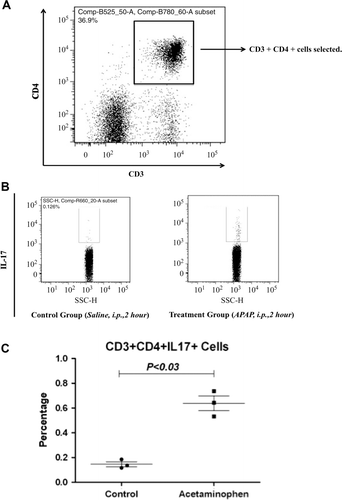
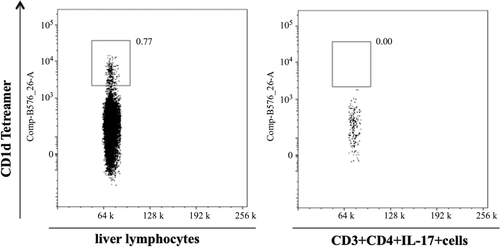
Figure 3.  APAP treatment increased levels of IL-17-producing CD4+ T-cells in the liver after 2 h. (a) CD3 and CD4 double-positive cells were gated for further analysis. (b) Example of IL-17 expression compared between control and treatment animals; the x-axis is side scatter (SSC). (c) Percentage of CD4+IL-17+ T-cells in the liver 2 h after APAP treatment compared with controls. Results shown are the mean (± SE) from three mice. Similar results were obtained in three independent experiments (p < 0.03).

Figure 4.  Comparison of staining for CD1d tetramer (NKT cell marker) in total hepatic lymphocytes (left panel) and hepatic lymphocytes that stain positive for CD3/CD4/IL-17 from (right panel). The x-axis is side scatter (SSC).

Figure 4.  Comparison of staining for CD1d tetramer (NKT cell marker) in total hepatic lymphocytes (left panel) and hepatic lymphocytes that stain positive for CD3/CD4/IL-17 from Figure 3 (right panel). The x-axis is side scatter (SSC).

Reprints and Corporate Permissions

Please note: Selecting permissions does not provide access to the full text of the article, please see our help page How do I view content?

To request a reprint or corporate permissions for this article, please click on the relevant link below:

Academic Permissions

Please note: Selecting permissions does not provide access to the full text of the article, please see our help page How do I view content?

Obtain permissions instantly via Rightslink by clicking on the button below:

If you are unable to obtain permissions via Rightslink, please complete and submit this Permissions form. For more information, please visit our Permissions help page.