3,429
Views
5
CrossRef citations to date
0
Altmetric
Paper from the 20th Summerschool in Immunotoxicology, Beaune, France, Sept. 26–28, 2011

Methods: Implementation of in vitro and ex vivo phagocytosis and respiratory burst function assessments in safety testing

, , &
Pages 106-117 | Received 29 Jun 2012, Accepted 29 Sep 2012, Published online: 23 Nov 2012

Figures & data

Figure 1.  Plate-based phagocytosis method test results. Adherent cells from rat alveolar lavage fluid (n = 3, x-axis) were treated with HBSS alone; 12.5 ng/mL PMA and 5 nM fMLP; or PMA, fMLP, and 10 µM rottlerin upon addition of fluoroscein labeled E. coli. Results are expressed as mean fluorescence intensity (y-axis). Error bars represent the standard deviation of triplicate wells. Rottlerin is abbreviated to Rott in the graph legend.
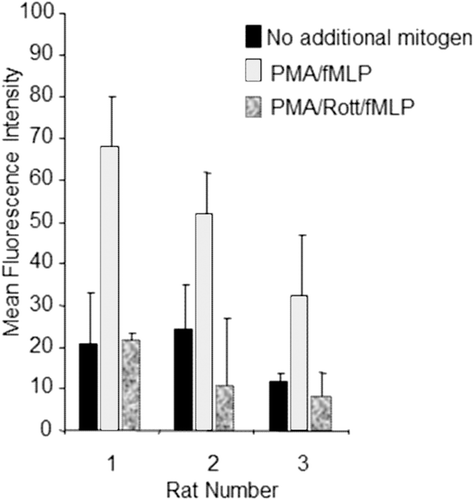
Figure 1.  Plate-based phagocytosis method test results. Adherent cells from rat alveolar lavage fluid (n = 3, x-axis) were treated with HBSS alone; 12.5 ng/mL PMA and 5 nM fMLP; or PMA, fMLP, and 10 µM rottlerin upon addition of fluoroscein labeled E. coli. Results are expressed as mean fluorescence intensity (y-axis). Error bars represent the standard deviation of triplicate wells. Rottlerin is abbreviated to Rott in the graph legend.

Figure 2.  Flow cytometric-based phagocytosis method test results. Whole blood was treated with 0.2, 1, 5, and 20 µM SB203580 prior to addition of fluoroscein-labeled E. coli. Graph depicts percent inhibition (y-axis) of MFI in SB203580-treated monkey whole blood relative to untreated control samples for neutrophils and monocytes. Data represent three independent assay days with blood from eight monkeys tested per day at each of the four SB203580 concentrations (escalating from left to right).
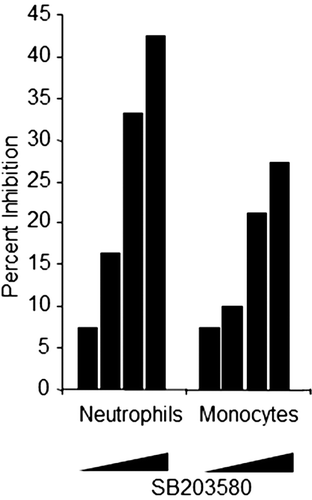
Figure 2.  Flow cytometric-based phagocytosis method test results. Whole blood was treated with 0.2, 1, 5, and 20 µM SB203580 prior to addition of fluoroscein-labeled E. coli. Graph depicts percent inhibition (y-axis) of MFI in SB203580-treated monkey whole blood relative to untreated control samples for neutrophils and monocytes. Data represent three independent assay days with blood from eight monkeys tested per day at each of the four SB203580 concentrations (escalating from left to right).

Figure 3.  Plate-based respiratory burst test results. Adherent cells from CD1 mouse alveolar lavage fluid (n = 3, x-axis) were treated with vehicle (DMSO ≤ 0.1%) or stimulated with 12.5 ng/mL PMA and 2 mg/mL zymosan in the presence or absence of 10 µM rottlerin or 10 µM wortmannin. Respiratory burst stimulants were added at the same time as rottlerin or wortmannin. Data are represented as fold over unstimulated (vehicle control; y-axis); mean fluorescence values for cells stimulated with PMA and Zymosan in the presence or absence of either rottlerin or wortmannin were divided by mean fluorescence values resulting from the unstimulated cells per each mouse.
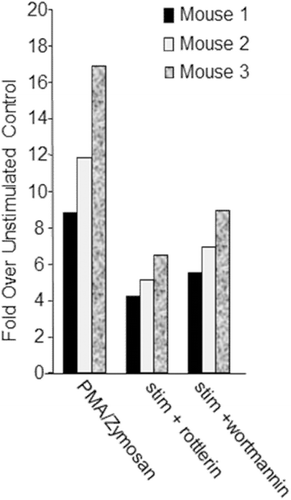
Figure 3.  Plate-based respiratory burst test results. Adherent cells from CD1 mouse alveolar lavage fluid (n = 3, x-axis) were treated with vehicle (DMSO ≤ 0.1%) or stimulated with 12.5 ng/mL PMA and 2 mg/mL zymosan in the presence or absence of 10 µM rottlerin or 10 µM wortmannin. Respiratory burst stimulants were added at the same time as rottlerin or wortmannin. Data are represented as fold over unstimulated (vehicle control; y-axis); mean fluorescence values for cells stimulated with PMA and Zymosan in the presence or absence of either rottlerin or wortmannin were divided by mean fluorescence values resulting from the unstimulated cells per each mouse.

Figure 4.  Flow cytometric-based respiratory burst results. Whole blood from Sprague Dawley rats (n = 7, x-axis) was incubated for 1 h in the absence or presence of 20 µM SB203580 or 5 µg/mL cytochalasin D, prior to addition of respiratory burst stimulant, PMA. Data are presented as MFI (y-axis). Even though data is presented in an uncalculated format (i.e. percent inhibition or fold change), standard deviation is not represented since samples were only analyzed in duplicate.
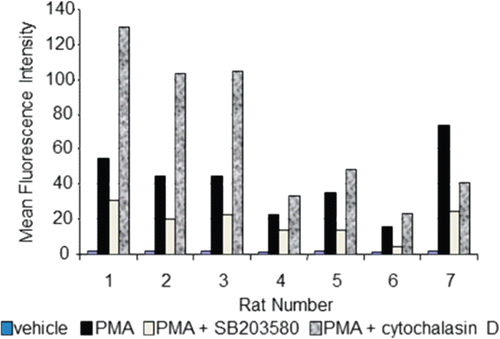
Figure 4.  Flow cytometric-based respiratory burst results. Whole blood from Sprague Dawley rats (n = 7, x-axis) was incubated for 1 h in the absence or presence of 20 µM SB203580 or 5 µg/mL cytochalasin D, prior to addition of respiratory burst stimulant, PMA. Data are presented as MFI (y-axis). Even though data is presented in an uncalculated format (i.e. percent inhibition or fold change), standard deviation is not represented since samples were only analyzed in duplicate.

Table 1.  Phagocytosis range-finding assessment experiments.

Table 2.  Phagocytosis definitive assessment parameters.

Table 3.  Incidence of inhibition of neutrophil phagocytosis function.

Figure 5.  Effects of BMS-582949 on phagocytosis function in monkey and rat neutrophils in vitro (x-axis). Data are presented as percent inhibition of phagocytosis in vehicle control samples independently calculated for each animal (y-axis). For monkeys, n = 8 (four/sex) and for rat, n = 16 (eight/sex), except n = 15 (eight male and seven female) for rat at 0.05 µM treatment. Triplicate (except no replicates for two of eight monkeys and one of 15 rats at 0.05 µM) MFI values were averaged for each parameter per assay prior to percent inhibition calculation. Each individual monkey data point is a median of three independent assays. Each individual rat data point represents a single assessment per rat. Color-coded bars represent the median of the individual data per BMS-582949 treatment concentration.
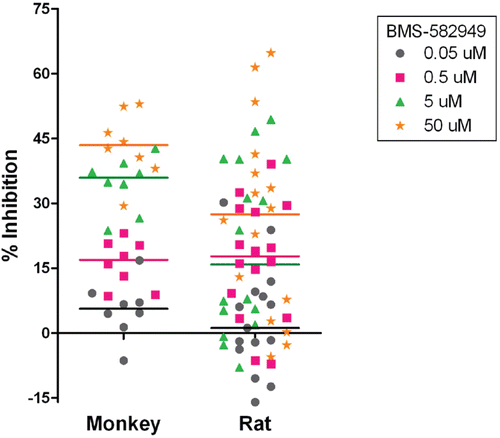
Figure 5.  Effects of BMS-582949 on phagocytosis function in monkey and rat neutrophils in vitro (x-axis). Data are presented as percent inhibition of phagocytosis in vehicle control samples independently calculated for each animal (y-axis). For monkeys, n = 8 (four/sex) and for rat, n = 16 (eight/sex), except n = 15 (eight male and seven female) for rat at 0.05 µM treatment. Triplicate (except no replicates for two of eight monkeys and one of 15 rats at 0.05 µM) MFI values were averaged for each parameter per assay prior to percent inhibition calculation. Each individual monkey data point is a median of three independent assays. Each individual rat data point represents a single assessment per rat. Color-coded bars represent the median of the individual data per BMS-582949 treatment concentration.
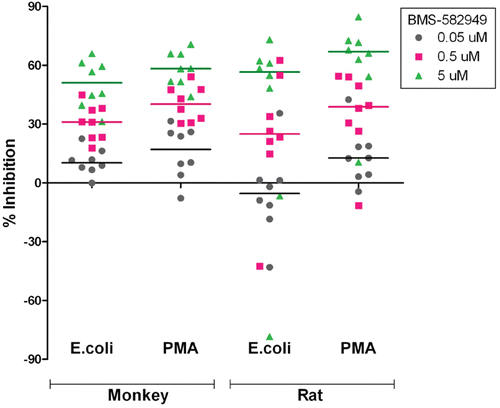
Table 4.  Respiratory burst range-finding assessment experiments.

Table 5.  Respiratory burst definitive assessment parameters.

Table 6.  IC30 values for BMS-582949 effects on neutrophil respiratory burst function.

Table 7.  Incidence of neutrophil respiratory burst function inhibition.

Figure 6.  Effects of BMS-582949 on respiratory burst function in monkey and rat neutrophils in vitro. n = 8 (four/sex) per stimulation condition and per species (x-axis). Data are presented as percent inhibition of stimulated respiratory burst in vehicle-control samples independently calculated for each animal (y-axis). Triplicate MFI values were averaged for each parameter per assay prior to percent inhibition calculation. Each individual monkey data point is a median of three independent assays. Each individual rat data point represents a single assessment per rat. Color-coded bars represent the median of the individual data per BMS-582949 treatment concentration.
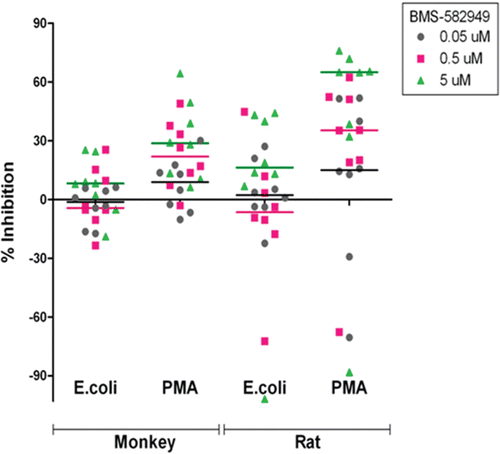
Figure 6.  Effects of BMS-582949 on respiratory burst function in monkey and rat neutrophils in vitro. n = 8 (four/sex) per stimulation condition and per species (x-axis). Data are presented as percent inhibition of stimulated respiratory burst in vehicle-control samples independently calculated for each animal (y-axis). Triplicate MFI values were averaged for each parameter per assay prior to percent inhibition calculation. Each individual monkey data point is a median of three independent assays. Each individual rat data point represents a single assessment per rat. Color-coded bars represent the median of the individual data per BMS-582949 treatment concentration.

Table 8.  Incidence of inhibition of monocyte respiratory burst function.

Figure 7.  Effects of BMS-582949 on respiratory burst function in monkey and rat monocytes in vitro. n = 8 (four/sex) per stimulation condition and per species (x-axis). Data are presented as percent inhibition of stimulated respiratory burst in vehicle-control samples independently calculated for each animal (y-axis). Triplicate MFI values were averaged for each parameter per assay prior to percent inhibition calculation. Each individual monkey data point is a median of three independent assays. Each individual rat data point represents a single assessment per rat. Color-coded bars represent the median of the individual data per BMS-582949 treatment concentration.

Figure 7.  Effects of BMS-582949 on respiratory burst function in monkey and rat monocytes in vitro. n = 8 (four/sex) per stimulation condition and per species (x-axis). Data are presented as percent inhibition of stimulated respiratory burst in vehicle-control samples independently calculated for each animal (y-axis). Triplicate MFI values were averaged for each parameter per assay prior to percent inhibition calculation. Each individual monkey data point is a median of three independent assays. Each individual rat data point represents a single assessment per rat. Color-coded bars represent the median of the individual data per BMS-582949 treatment concentration.

Figure 8.  Effects of BMS-582949 on phagocytosis in monkey neutrophils. Monkeys were administered vehicle or BMS-582949 at 1, 10, and 75 mg/kg for 7 days and peripheral blood neutrophils were analyzed for phagocytosis on study days 4, 5, 8, and 9 (x-axis). Data are presented as percent inhibition of the per day averaged vehicle-control sample MFI (y-axis). Triplicate MFI values were averaged for each test parameter. Data were normalized to pre-test MFI values prior to calculation of percent inhibition. Color-coded bars represent the group median percent inhibition.
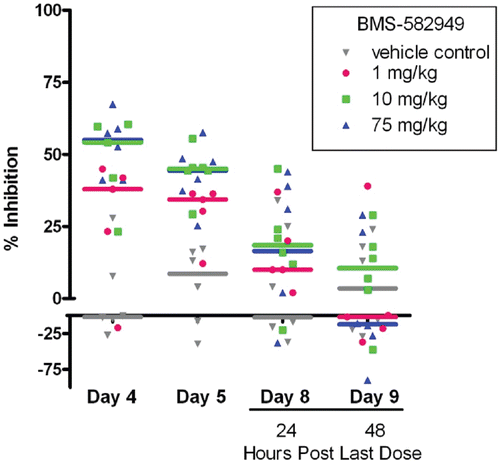
Figure 8.  Effects of BMS-582949 on phagocytosis in monkey neutrophils. Monkeys were administered vehicle or BMS-582949 at 1, 10, and 75 mg/kg for 7 days and peripheral blood neutrophils were analyzed for phagocytosis on study days 4, 5, 8, and 9 (x-axis). Data are presented as percent inhibition of the per day averaged vehicle-control sample MFI (y-axis). Triplicate MFI values were averaged for each test parameter. Data were normalized to pre-test MFI values prior to calculation of percent inhibition. Color-coded bars represent the group median percent inhibition.

Figure 9.  Effects of BMS-582949 on (a) E.coli or (b) PMA stimulated respiratory burst in monkey neutrophils. Monkeys were administered vehicle or BMS-582949 at 1, 10, and 75 mg/kg for 7 days and peripheral blood neutrophils were analyzed for respiratory burst function on study days 4, 5, 8, 9, 10, and 12 (PMA stimulation only day 12; x-axis). Data are presented as percent inhibition of the per day averaged vehicle-control sample MFI (y-axis). Triplicate MFI values were averaged for each test parameter. Data were normalized to pre-test MFI values prior to calculation of percent inhibition. Color-coded bars represent the group median percent inhibition. Figure was modified from Price (Citation2010).
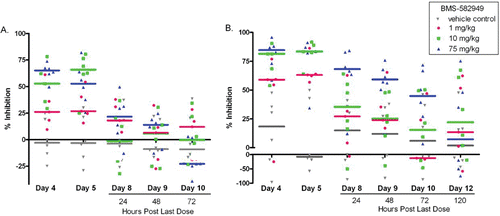
Figure 9.  Effects of BMS-582949 on (a) E.coli or (b) PMA stimulated respiratory burst in monkey neutrophils. Monkeys were administered vehicle or BMS-582949 at 1, 10, and 75 mg/kg for 7 days and peripheral blood neutrophils were analyzed for respiratory burst function on study days 4, 5, 8, 9, 10, and 12 (PMA stimulation only day 12; x-axis). Data are presented as percent inhibition of the per day averaged vehicle-control sample MFI (y-axis). Triplicate MFI values were averaged for each test parameter. Data were normalized to pre-test MFI values prior to calculation of percent inhibition. Color-coded bars represent the group median percent inhibition. Figure was modified from Price (Citation2010).

Reprints and Corporate Permissions

Please note: Selecting permissions does not provide access to the full text of the article, please see our help page How do I view content?

To request a reprint or corporate permissions for this article, please click on the relevant link below:

Academic Permissions

Please note: Selecting permissions does not provide access to the full text of the article, please see our help page How do I view content?

Obtain permissions instantly via Rightslink by clicking on the button below:

If you are unable to obtain permissions via Rightslink, please complete and submit this Permissions form. For more information, please visit our Permissions help page.