3,574
Views
34
CrossRef citations to date
0
Altmetric
Research Article

Cannabidiol (CBD) enhances lipopolysaccharide (LPS)-induced pulmonary inflammation in C57BL/6 mice

, , , &
Pages 321-328 | Received 08 Aug 2012, Accepted 16 Oct 2012, Published online: 23 Nov 2012

Figures & data

Figure 1.  Characterization of LPS-induced pulmonary inflammation. LPS or saline (Sal) was instilled intranasally and inflammatory cell infiltration in the BALF was assessed. Values shown are mean cells/ml ± SE (≥ 6 animals/group). (A) Neutrophil and (B) monocyte counts over time in response to 50 µg LPS/mouse. (C) Neutrophil and (D) monocyte counts in response to various doses of LPS at 6 and 24 h post-instillation. NA, naive (untreated); Sal, 2 h post-Sal. *p < 0.05 as compared to Sal.
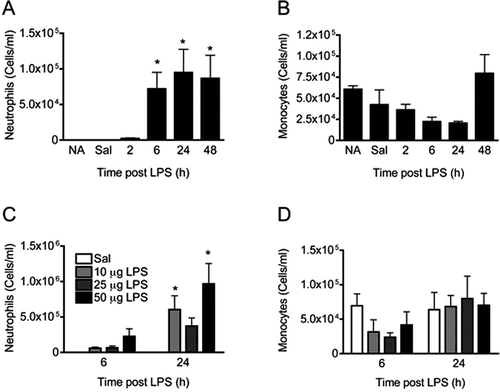
Figure 1.  Characterization of LPS-induced pulmonary inflammation. LPS or saline (Sal) was instilled intranasally and inflammatory cell infiltration in the BALF was assessed. Values shown are mean cells/ml ± SE (≥ 6 animals/group). (A) Neutrophil and (B) monocyte counts over time in response to 50 µg LPS/mouse. (C) Neutrophil and (D) monocyte counts in response to various doses of LPS at 6 and 24 h post-instillation. NA, naive (untreated); Sal, 2 h post-Sal. *p < 0.05 as compared to Sal.

Figure 2.  Effect of CBD on LPS-induced pulmonary inflammatory cell infiltration. Mice were administered CBD (75 mg/kg/day) in corn oil by oral gavage for 3 days. On the third day, ~ 1 h before the last dose of CBD, mice received either Sal or LPS (10 µg/mouse) intranasally. Values shown are mean cells/ml ± SE (≥ 6 animals/group). Results are representative of two separate experiments. * p < 0.05 as compared to LPS/Oil.
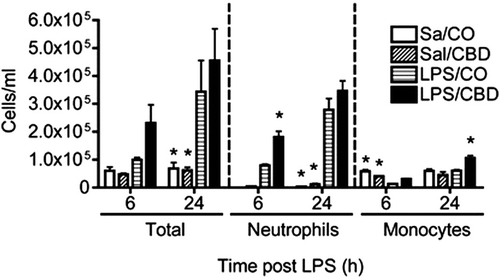
Figure 2.  Effect of CBD on LPS-induced pulmonary inflammatory cell infiltration. Mice were administered CBD (75 mg/kg/day) in corn oil by oral gavage for 3 days. On the third day, ~ 1 h before the last dose of CBD, mice received either Sal or LPS (10 µg/mouse) intranasally. Values shown are mean cells/ml ± SE (≥ 6 animals/group). Results are representative of two separate experiments. * p < 0.05 as compared to LPS/Oil.

Figure 3.  Effect of CBD on LPS-induced acute pulmonary centriacinar inflammation. Mice were treated as outlined in the legend for . Left lung lobes (6 h post-LPS) were fixed and sections were stained with NIMP-R14 anti-neutrophil antibody and counter-stained with hematoxylin. (A) Sal/Oil; (B) LPS/Oil; (C) Sal/CBD; (D) LPS/CBD. Arrows depict positive staining for neutrophils in the centriacinar region of the lung. a, alveoli; ad, alveolar duct; tb, terminal bronchiole. Neutrophilic inflammation is present in (B) and (D), with enhanced neutrophilic influx in the proximal alveolar ducts and associated alveoli in D compared to B.
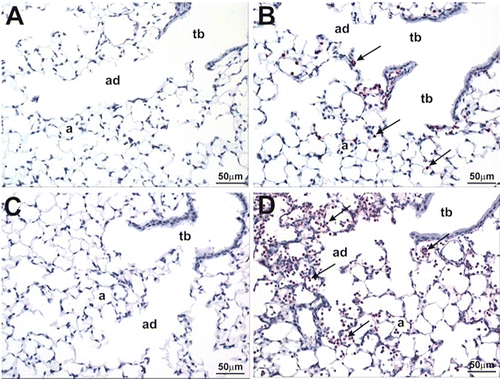
Figure 3.  Effect of CBD on LPS-induced acute pulmonary centriacinar inflammation. Mice were treated as outlined in the legend for Figure 2. Left lung lobes (6 h post-LPS) were fixed and sections were stained with NIMP-R14 anti-neutrophil antibody and counter-stained with hematoxylin. (A) Sal/Oil; (B) LPS/Oil; (C) Sal/CBD; (D) LPS/CBD. Arrows depict positive staining for neutrophils in the centriacinar region of the lung. a, alveoli; ad, alveolar duct; tb, terminal bronchiole. Neutrophilic inflammation is present in (B) and (D), with enhanced neutrophilic influx in the proximal alveolar ducts and associated alveoli in D compared to B.

Figure 4.  Effect of CBD on type II epithelial cell proliferation. Mice were treated as outlined in the legend for . Left lung lobes (24 h post-LPS) were fixed and sections were stained with hematoxylin and eosin. (a) Sal/CBD; (b) LPS/CBD. Dashed arrow depicts neutrophils; arrow depicts type II epithelial cell proliferation. a, alveoli; ad, alveolar duct.
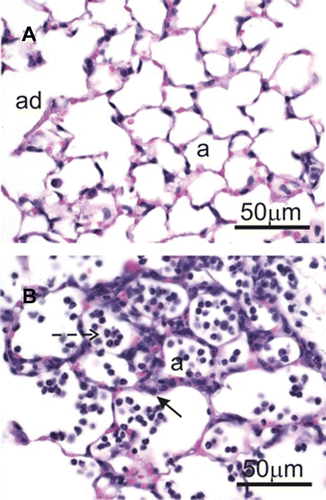
Figure 4.  Effect of CBD on type II epithelial cell proliferation. Mice were treated as outlined in the legend for Figure 2. Left lung lobes (24 h post-LPS) were fixed and sections were stained with hematoxylin and eosin. (a) Sal/CBD; (b) LPS/CBD. Dashed arrow depicts neutrophils; arrow depicts type II epithelial cell proliferation. a, alveoli; ad, alveolar duct.

Figure 5.  Effect of CBD on LPS-induced pro-inflammatory cytokines. Mice were treated as outlined in the legend for . Total RNA was isolated from right lung lobes and QRT-PCR was performed. Bars represent fold-change relative to naive (NA) group at 6 h (NA; not analyzed at 24-h timepoint). Results are representative from two separate experiments. * p < 0.05 as compared to LPS/Oil at each respective timepoint.
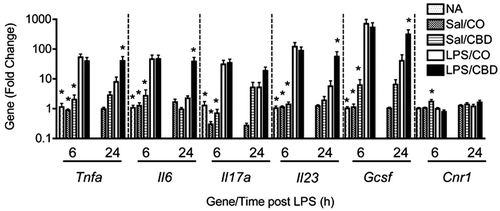
Figure 5.  Effect of CBD on LPS-induced pro-inflammatory cytokines. Mice were treated as outlined in the legend for Figure 2. Total RNA was isolated from right lung lobes and QRT-PCR was performed. Bars represent fold-change relative to naive (NA) group at 6 h (NA; not analyzed at 24-h timepoint). Results are representative from two separate experiments. * p < 0.05 as compared to LPS/Oil at each respective timepoint.

Table 1.  Serum levels of CBD.

Reprints and Corporate Permissions

Please note: Selecting permissions does not provide access to the full text of the article, please see our help page How do I view content?

To request a reprint or corporate permissions for this article, please click on the relevant link below:

Academic Permissions

Please note: Selecting permissions does not provide access to the full text of the article, please see our help page How do I view content?

Obtain permissions instantly via Rightslink by clicking on the button below:

If you are unable to obtain permissions via Rightslink, please complete and submit this Permissions form. For more information, please visit our Permissions help page.