Figures & data
Figure 1. Specificity of immune responses to CMV and LCV antigens as measured by IFN-γ ELISPOT. PBMC were stimulated with media alone, CMV antigen, LCV antigen, or stimulatory anti-CD3 (αCD3) antibody and IFN-γ producing cells were enumerated by ELISPOT assay. (a) PBMC from CMV and LCV seropositive (+) versus seronegative (−) rhesus monkeys were used as specificity controls for responses following stimulation with the relevant antigen. Images showing representative ELISPOT wells are shown. (b) T-cell contribution to IFN-γ production was determined using PBMC from cynomolgus monkeys that were T-cell depleted with αCD3 antibody (αCD3 Depletion) or mock depleted with an isotype matched control antibody (Mock Depletion) prior to seeding in the ELISPOT assay. PBMC seeding density was adjusted to account for CD3+ T-cell loss, so that equivalent numbers of non-T-cells were compared. The cells were stimulated with CMV, LCV, or αCD3 antibody. The numbers of spot-forming cells (SFC)/106 PBMC are shown. Data shown are representative of two independent experiments.
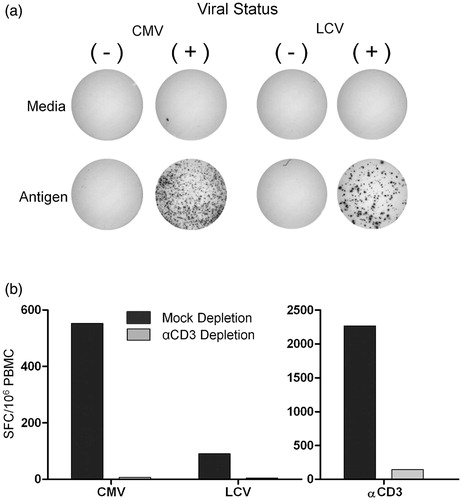
Figure 2. LCV-specific responses using LCV antigen generated from LCL pre-treated with PMA and sodium butyrate. PBMC were stimulated with media alone or LCV antigen generated from either non-treated LCL (Untreated) or LCL treated with 20 ng PMA/ml and 3 mM sodium butyrate for 72 h (PMA/NaB treated), and then IFN-γ-secreting cells were assessed by ELISPOT assay. (a) T-cell responses of four individual animals stimulated with untreated or PMA/NaB-treated LCL are shown. (b) PBMC from LCV seronegative (−) and seropositive (+) rhesus monkeys were routinely tested to ensure specificity of LCV antigen responses. Data shown are representative of 11 independent experiments encompassing 12 seronegative and 15 seropositive rhesus monkeys. Numbers indicate SFC for each image.
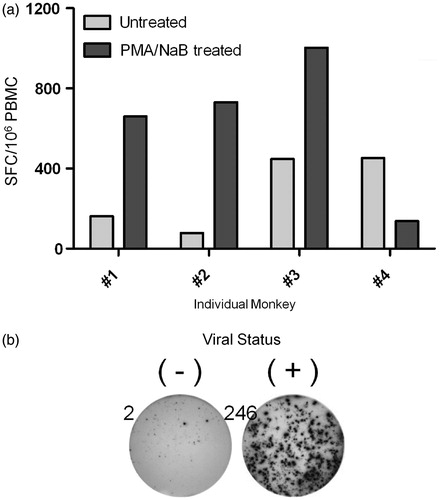
Table 1. Parameters evaluated to assess impact on assay background.
Table 2. Inter-assay precision analysis.
Figure 3. Biological variability of monkey T-cell responses. Five male and five female untreated monkeys were bled every 2 weeks for 3 months and PBMC from each timepoint were frozen. PBMC were then stimulated with media alone, CMV antigen, LCV antigen, or αCD3 antibody and IFN-γ-producing cells were then enumerated by ELISPOT assay. (a) SFC/106 PBMC in response to CMV antigen, LCV antigen, and αCD3 antibody stimulation at outset of study. Data points represent individual animals. (b) Percent change in SFC/106 PBMC, relative to pre-treatment starting values, for T-cell responses to CMV, LCV, and αCD3. Each line represents an individual animal.
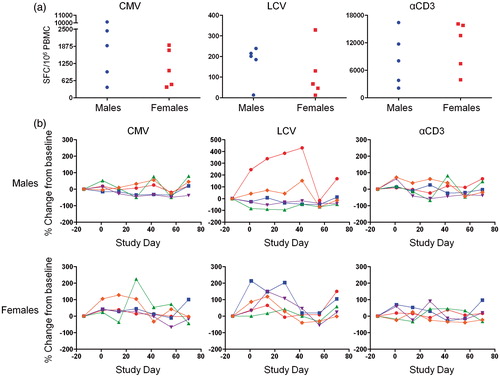
Table 3. Sample size and power analysis.
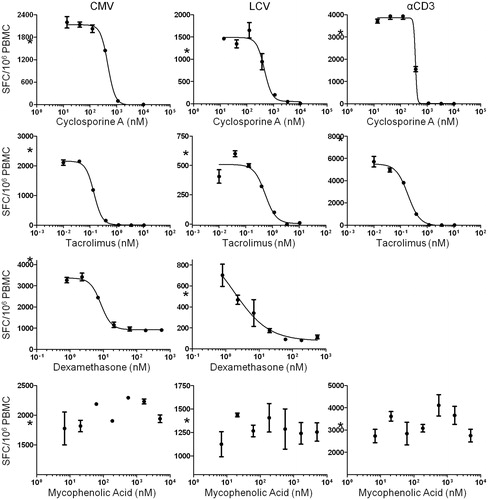
Figure 4. Sensitivity of antigen-specific T-cell responses to in vitro immune suppression as measured by IFN-γ ELISPOT. PBMC were stimulated with media alone, CMV antigen, LCV antigen, and αCD3 antibody in the presence of serial dilutions of cyclosporine A (13.7–10 000 nM), tacrolimus (0.01–10.5 nM), dexamethasone (0.8–556 nM), and mycophenolic acid (68.6–50 000 nM), and IFN-γ-producing cells were then quantified. Each data point represents the mean SFC/106 PBMC (±SD) of duplicate wells. Each plot shows data from an individual animal. Asterisks (*) on y-axes indicate SFC obtained in vehicle control wells. Data is representative of multiple independent experiments with multiple animals (cyclosporine A, n = 5; tacrolimus, n = 5; dexamethasone, n = 5; mycophenolic acid, n = 3).