Figures & data
Figure 1. Chemical structure of pinocembrin (PNCB).
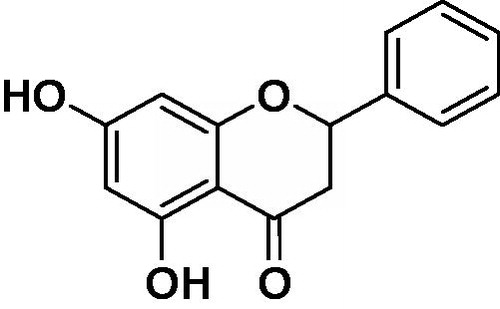
Figure 2. Survival rate (%) of mice challenged with LPS of different doses. Mice were injected IP with 5, 10, 20, or 40 mg LPS/kg (n = 12/group) without any treatment with pinocembrin. Survival was then monitored every 12 h for 7 days (p < 0.05).
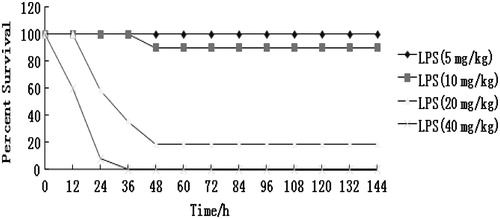
Figure 3. Effect of pre-treatment with pinocembrin (PNCB) on LPS-induced lethality in mice. Mice were divided into control, LPS (20 mg/kg) only, and LPS (20 mg/kg) + PNCB treatment groups (n = 12/group). Survival was then monitored every 12 h for 7 days. **p < 0.01 versus LPS-only group.
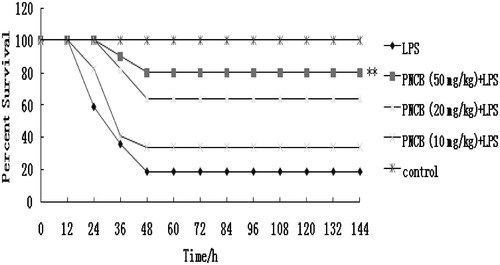
Figure 4. Effect of post-treatment with pinocembrin (PNCB) on LPS-induced lethality in mice. Mice were divided into control, LPS (20 mg/kg) only, and LPS (20 mg/kg) + PNCB treatment groups (n = 12/group). Survival was then monitored every 12 h for 7 days. p < 0.01 versus LPS-only group.
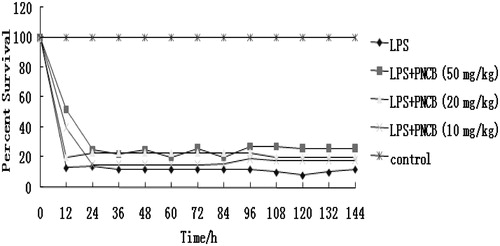
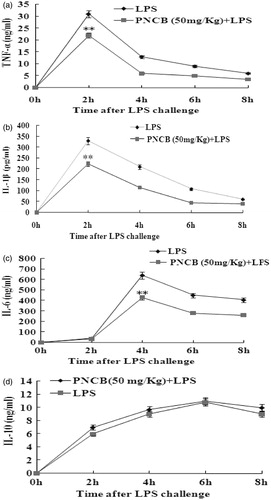
Figure 5. Influence of a single dose of pinocembrin on cytokine responses induced by a lethal dose of LPS. Mice were injected IP with pinocembrin 1 h before challenge with the LPS (20 mg/kg). Blood was isolated from the tail vein of each mouse at 0, 2, 4, 6, and 8 h post-LPS challenge and serum levels of TNFα, IL-1β, IL-6, and IL-10 then measured using ELISA. Data are presented as means (±SE) from n = 12 mice/group. **p < 0.01 versus LPS-only group.