
Figures & data
Table 1. Relative organ weights after adalimumab or infliximab treatment.
Figure 1. Adalimumab levels in the plasma of individual minipigs during time. Minipigs were treated SC every other week for 8 weeks with (a) 0.1, (b) 1.0, or (c) 5.0 mg adalimumab/kg.
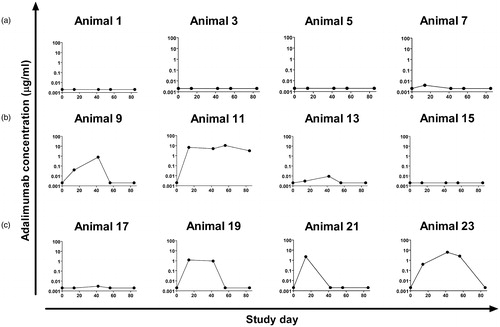
Figure 2. Anti-adalimumab antibody (AAA) levels in serum of individual minipigs. Minipigs were treated SC every other week for 8 weeks with (a) 0.1, (b) 1.0, or (c) 5.0 mg adalimumab/kg. Anti-adalimumab levels were followed during time.
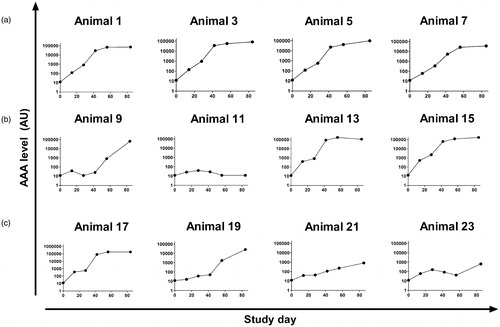
Figure 3. Infliximab levels in individual minipigs. Minipigs were treated SC every other week for 8 weeks with 5.0 mg infliximab/kg. Infliximab and anti-infliximab levels were followed over time. Arrows indicate treatment days. No anti-infliximab antibodies were observed during the study.
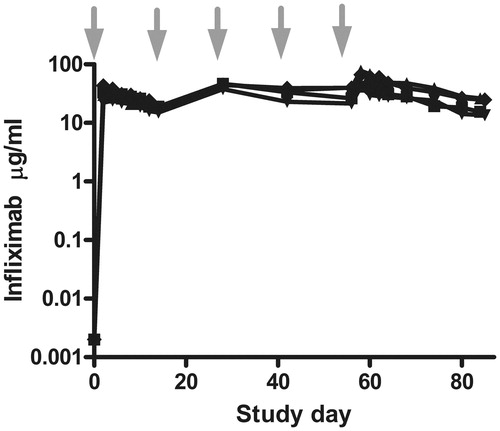
Figure 4. Plasma concentration vs time curves for individual minipigs receiving intramuscular dose of (a) 0.1, (b) 1.0, or (c) 5.0 mg adalimumab/kg after the first (Day 0) and final (Day 56) dose sessions. Sessions are indicated by arrows above the figure. Results presented here were used for PK analysis.
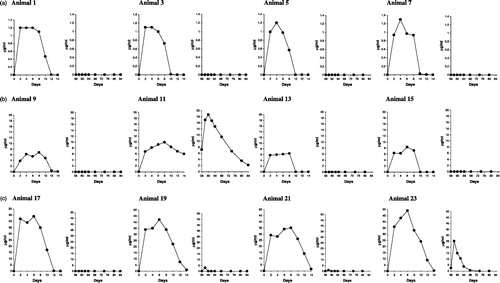
Table 2. Pharmacokinetic parameters for adalimumab and infliximab following SC dosing to female Göttingen minipigs every other week for 8 weeks (n = 4 per group).