Figures & data
Table 1. Antibodies used to distinguish cell sub-sets.
Figure 1. Reduction in peritoneal B1a B-cells after 6-Mix exposure. B1a cells = IgM+, CD5+, CD23−; B1a cells = IgM+, CD5−, CD23− (all gated on lymphocytes). (a) Mice were treated with fibers by IP instillation (100 μg/mouse for fibers or 1 μg/mouse for LPS). At Day 7 post-treatment cells were isolated from hosts and analyzed; values presented are the percent of peritoneal B-cells (CD3- lymphocytes). (b) 24 h or 3 day in vivo [as in a]. Values shown were calculated by multiplying percent positive by the total number of cells. (c) Peritoneal B-cell populations after in vitro treatment at 25 μg/cm2 for 24 h or 3 days. n = 3–5 mice (or wells)/group; values shown in each figure are mean ± SEM. *p < 0.05 compared to Saline (a, b) or No Treatment (c) value at the same time point.
![Figure 1. Reduction in peritoneal B1a B-cells after 6-Mix exposure. B1a cells = IgM+, CD5+, CD23−; B1a cells = IgM+, CD5−, CD23− (all gated on lymphocytes). (a) Mice were treated with fibers by IP instillation (100 μg/mouse for fibers or 1 μg/mouse for LPS). At Day 7 post-treatment cells were isolated from hosts and analyzed; values presented are the percent of peritoneal B-cells (CD3- lymphocytes). (b) 24 h or 3 day in vivo [as in a]. Values shown were calculated by multiplying percent positive by the total number of cells. (c) Peritoneal B-cell populations after in vitro treatment at 25 μg/cm2 for 24 h or 3 days. n = 3–5 mice (or wells)/group; values shown in each figure are mean ± SEM. *p < 0.05 compared to Saline (a, b) or No Treatment (c) value at the same time point.](/cms/asset/fa83439c-105e-4f70-8923-91b733a0e069/iimt_a_796024_f0001_b.jpg)
Figure 2. Reduction in pleural B1a B-cells after intratracheal exposure to 6-Mix. Mice were exposed through endotracheal instillation (at 60 μg 6-Mix/mouse) in 60 μl sterile saline and then cells were harvested at the indicated times post-treatment. Harvested pleural cells were stained for B1a B-cells (IgM+, CD5+, CD23−). Values shown are mean (±SEM) percent positive of all gated lymphocytes. n = 5/group. *p < 0.05 compared to saline value at the same time point.
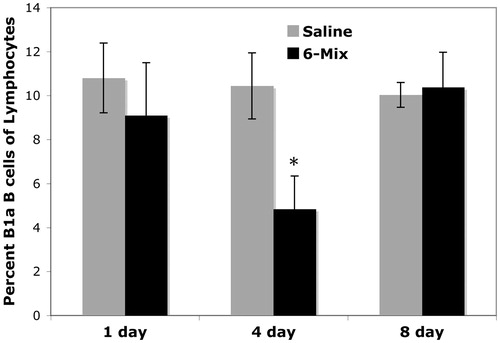
Figure 3. α4 Integrin expression on B1a B-cells from the peritoneal cavity after treatment. (a) In vivo exposure, single dose of 100 μg/mouse, cell harvest at Day 3 post-treatment, n = 3 mice/group. (b) In vitro exposure, 25 μg/cm2, 24 h and 2 days of culture, n = 4 in each treatment group. In both figures, values shown are mean ± SEM. *p < 0.05 compared to Saline (a) or Media (b) at the same time point.
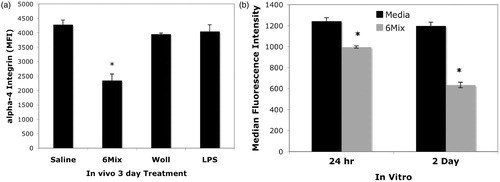
Figure 4. Asbestos exposure increased peritoneal IgM production. Mice were instilled IP once with 100 μg 6-Mix, or LPS (1 μg/mouse), or saline vehicle. After 3 days, peritoneal fluid was then collected and assayed for immunoglobulin using a mouse isotyping kit. n = 3/group; values shown are mean ± SEM. *p < 0.05 compared to saline value.
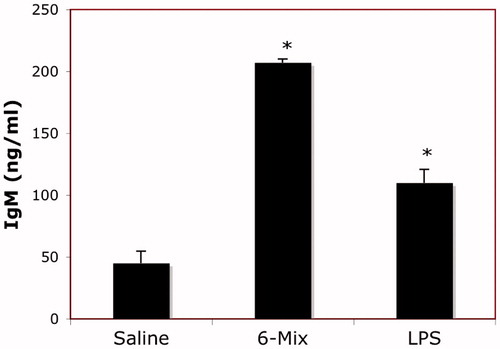
Figure 5. Percentage of MHC II+ B-cells was decreased in the peritoneum after exposure, consistent with a loss of B1a B-cells. Peritoneal cells were harvested (a) 3 days or (b) 7 days after host exposure and then stained. B1a cells = IgM+, CD5+, CD23−; B-cells = All lymphocytes minus T-cells (T = CD5+, IgM−). Representative histograms are presented below (a) demonstrating the reduction in B1a B-cells concurrent with loss of MHCII+ B-cells. (b) Similar outcomes as in (a) and showing similar effect of pure Korean tremolite but not the control fiber wollastonite (Woll). n = 4 mice/group. (c) In vitro experiments showed no change in expression of MHC II antigen, suggesting that the changes in vivo were due to trafficking. Peritoneal cells were cultured with or without 6-Mix for 3 days and then stained as in (a). n = 3 wells/treatment group. In each figure, values shown are mean ± SEM. *p< 0.05.
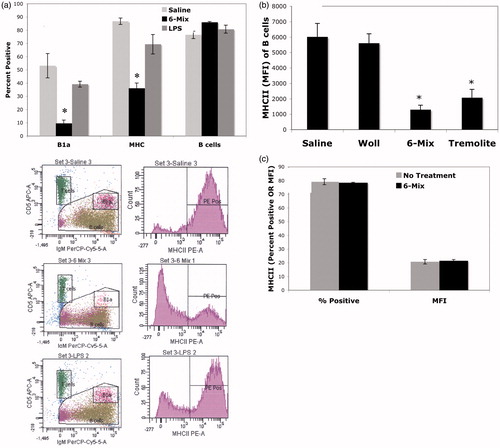
Figure 6. 6-Mix asbestos induces trafficking of B1a B-cells to spleen. Peritoneal lymphocytes from CD45.1 transgenic mice were adopted into wild-type mice with or without 100 μg of 6-Mix. (a) Spleens were harvested after 3 or 6 days, and splenocytes then counted and analyzed for expression of CD45.1 (PE), IgM (PerCP-Cy5.5), and CD5 (APC) gating on lymphocytes; the percent positive for all three markers was multiplied by total cell number to yield number of trafficked cells. n = 6/group; values shown are mean ± SEM. *p < 0.05 compared to cells only at same timepoint. (b) Representative histograms showing loss of CD45.1+ cells from peritoneum at 4 days after host treatment with asbestos (top right, compared to no treatment in top left), and an increase of CD45.1+ cells in the spleen at 6 days post-exposure (bottom right, compared to no treatment in bottom left).
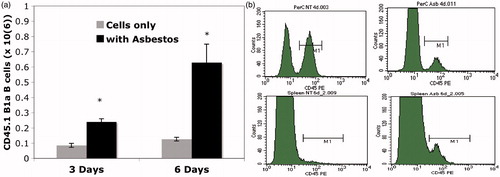
Figure 7. Spleens double in size within 6 days of 6-Mix asbestos exposure. Prior to preparing splenocytes for flow cytometry, spleens were gently dried and then weighed. All mice were the same age with no significant differences in size. n = 6–8 mice/group. *p < 0.05 compared to the saline group.
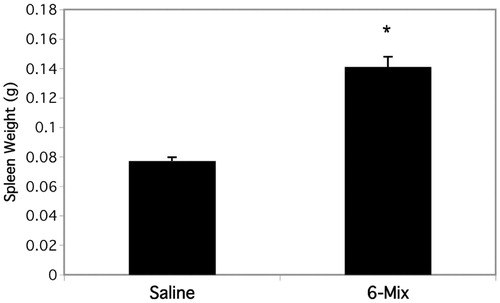
Figure 8. 6-Mix asbestos increased B1a B-cell trafficking to mesenteric lymph nodes. Peritoneal lymphocytes from CD45.1 transgenic mice were adopted into wild-type mice by IP injection with or without 100 μg 6-Mix asbestos. Mesenteric lymph nodes were then harvested and analyzed for expression of CD45.1 (PE), IgM (PerCP-Cy5.5) and CD5 (APC) gating on lymphocytes: the percent positive for all three markers was multiplied by total cell number to get number of trafficked cells. n = 8/group; values shown are mean ± SEM. *p < 0.05 compared to the saline group.
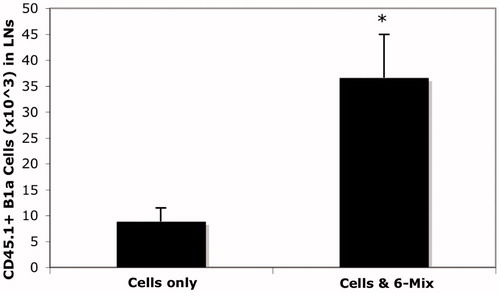
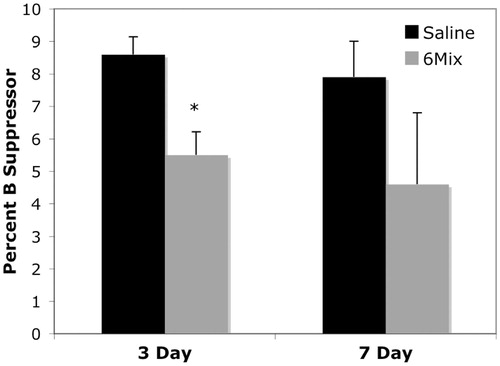
Figure 9. 6-Mix asbestos decreased the percentage of suppressor B-cells in splenic lymphocytes. Following IP exposure with or without 100 μg 6-Mix, peritoneal cells were collected at 3 and 7 days post-exposure and stained for IgM+ CD5+ CD11b+ CD1d+ suppressor B-cells. Data shows the percent B-suppressor cells (i.e. positive for all four markers) in the lymphocyte gate. n = 3/group; values shown are mean ± SEM. *p < 0.05 compared to the saline group at the same time point.