
Figures & data
Figure 1. Generation of SMX-GSH-MSA adducts. SMX (10 mM) was metabolized in vitro by hCYP450 2C9. The reactive metabolite SMX-NO was trapped by GSH and further conjugated to MSA with the use of EDC. SMX-GSH-MSA adducts (lane 1) were detected by immunoblot using anti-SMX antisera. Molecular mass markers (M) are indicated.
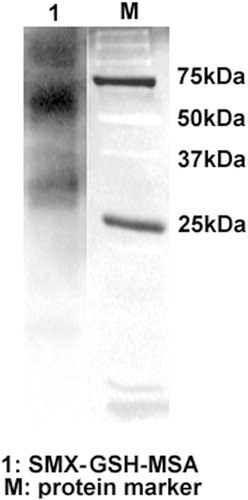
Figure 2. SMX-GSH-MSA adducts elicit drug-specific T-cell responses in mice. Female DBA/1 mice were immunized with SMX-GSH-MSA in combination with CFA and IFA. SMX-specific immune responses were evaluated by ex vivo re-stimulation of lymph node cells with nothing (none), SMX-NO (1 or 10 μg/ml) or SMX (50 μg/ml). Results from four mice per group are shown, and mean (±SEM) values compared. *p < 0.05 compared with cell stimulated with none.
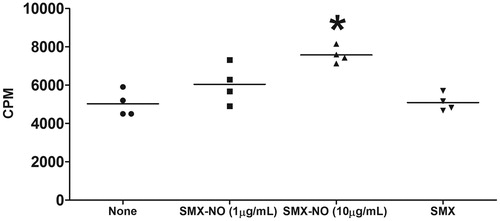
Figure 3. Mouse strain variation in response to SMX-GSH-MSA immunization. Female BALB/cJ, C57BL/6J, and DBA/1 mice were immunized with SMX-GSH-MSA in combination with CFA and IFA. SMX-specific immune responses were evaluated by ex vivo re-stimulation of lymph node cells with nothing (none) or SMX-NO (10 μg/ml) in (a), and with OVA (10 μg/mL) or SMX-GSH-OVA (10 μg/ml) in (b). Results from at least six mice per group are shown and mean (±SEM) values compared. *p < 0.05 compared with cells stimulated with nothing; #p < 0.05 compared with cells stimulated with OVA.
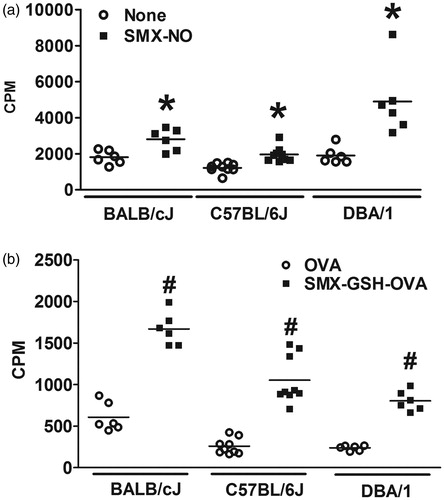
Figure 4. Comparison of SMX-specific immune responses generated at 1 and 2 weeks after immunization. Female DBA/1 mice were immunized with SMX-GSH-MSA in combination with CFA and IFA. Mice were sacrificed 1 or 2 weeks later. SMX-specific immune responses were evaluated by ex vivo re-stimulation of lymph node cells with nothing (none) or SMX-NO (10 μg/ml) in (a), and with OVA (10 μg/ml) or SMX-GSH-OVA (10 μg/ml) in (b). Results from four mice per group are shown and mean (±SEM) values compared. *p < 0.05 compared with cells stimulated with nothing; #p < 0.05 compared with cells stimulated with OVA.
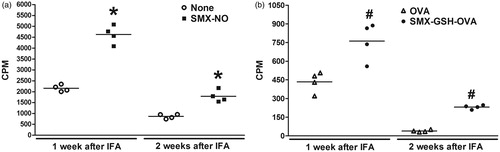
Figure 5. Generation of APAP-GSH-MSA adducts. APAP (10 mM) was metabolized in vitro by hCYP450 2E1. The reactive metabolite NAPQI was trapped by GSH and further conjugated to MSA with the use of EDC. APAP-GSH-MSA adducts (lane 1) were detected by immunoblot using anti-APAP antisera. Molecular mass markers (M) are indicated.
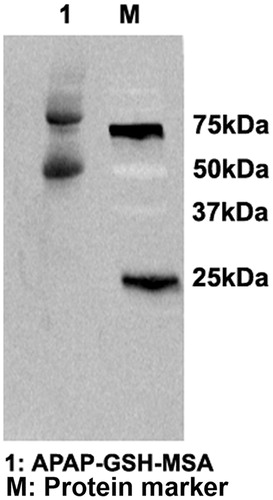
Figure 6. Percentage of animals in each treatment group with a positive assay response at each threshold level. Fold-change values were determined for each individual animal based on the response for RM-GSH-MSA compared to the MSA response alone. Using a defined fold-change value for a positive response, the percentage of animals positive at the given threshold were calculated.
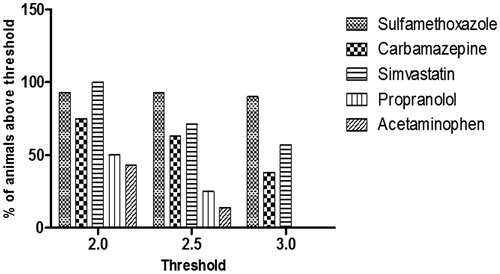
Table 1. Comparison of mean fold-changes (CPMRM-GSH-MSA/CPMMSA) of all animals tested for each drug.
Table 2. Numbers of animals in each treatment group with a positive assay response at each threshold level.