Figures & data
Table 1. Anti-SRBC antibody titer in chicks obtained from layer breeders fed AFB1 ± Vit E-containing feeds for 1 week.
Table 2. Anti-SRBC antibody titer in chicks obtained from layer breeders fed AFB1 ± Vit E-containing feeds for 3 week.
Figure 1. Lymphoproliferative response against phytohemagglutinin (PHA-P) in chicks from hens fed the test feeds for 1 or 3 weeks. At 14 days-of-age, 10 chicks/group were injected with PHA-P (100 μg PHA-P in 0.1 ml normal saline) into the intra-digital space between digits 3 and 4 of the right foot; 0.1 ml normal saline was injected similarly in the left foot. Skin thickness was then measured 24- and 48-h post-injection. The thickness response was then calculated and expressed (mm) as: cutaneous basophilic hypersensitivity response = (right foot skin thickness – left foot skin thickness), at each time-point. Dam on diets for (a) 1 week and (b) 3 weeks. Values shown are mean ( ± SD); n = 10/group. All groups (A–L) were fed the diets containing various amounts of AFB1 in the presence/absence of Vit E; specific exposure levels for each group are indicated in tables in this paper. Values significantly different from control (Group A chicks) values at *p ≤ 0.05 are indicated. Note: Due to limitations on overall egg production by hens in the 3-week Groups G and L, eggs (and thus progeny) were not available for this particular study.
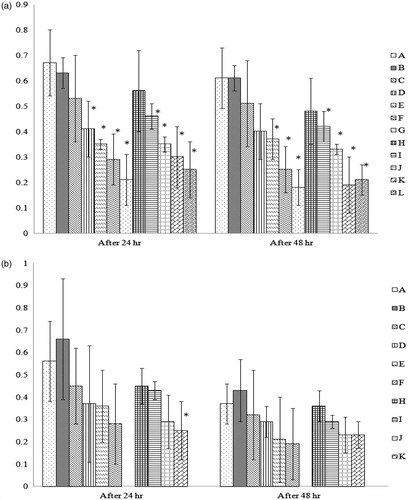
Figure 2. Phagocytic activity of peritoneal macrophages recovered from chicks of hens fed AFB1 ± Vit E for 1, 2, or 3 weeks. At 29 days-of-age, peritoneal macrophages were isolated from the chicks (n = 10/group). The cells were then cultured for 1 h to permit adherence and subsequently provided SRBC to engulf in a 1-h period. The cells were then stained and a total of 200 macrophages/chick scored for phagocytosis and number of SRBC engulfed/macrophage. Dam on diets for (a) 1 week, (b) 2 weeks, and (c) 3 weeks. Values shown are mean percentage (%) of phagocytically-active cells present (±SD); n = 10/group. All groups (A–L) were fed the diets containing various amounts of AFB1 in the presence/absence of Vit E; specific exposure levels for each group are indicated in tables in this paper. Values significantly different from control (Group A chicks) values at *p ≤ 0.05 are indicated.
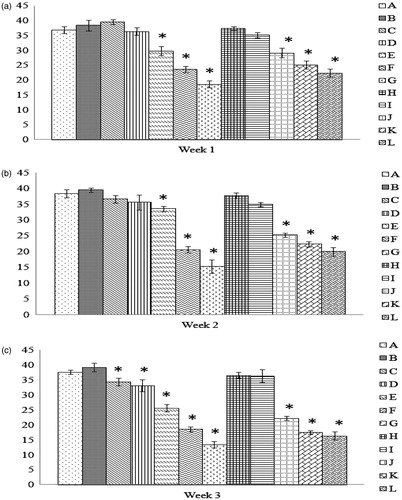
Figure 3. Number of SRBC engulfed/macrophage obtained from progeny chicks of hens fed AFB1 ± Vit E for 1, 2, or 3 weeks. Cells were prepared and treated as outlined in the legend for . Dam on diets for (a) 1 week, (b) 2 weeks, and (c) 3 weeks. Values shown are mean number of SRBC engulfed per phagocytically-active cell (±SD); n = 10/group. All groups (A–L) were fed the diets containing various amounts of AFB1 in the presence/absence of Vit E; specific exposure levels for each group are indicated in tables in this paper. Values significantly different from control (Group A chicks) values at *p ≤ 0.05 are indicated.
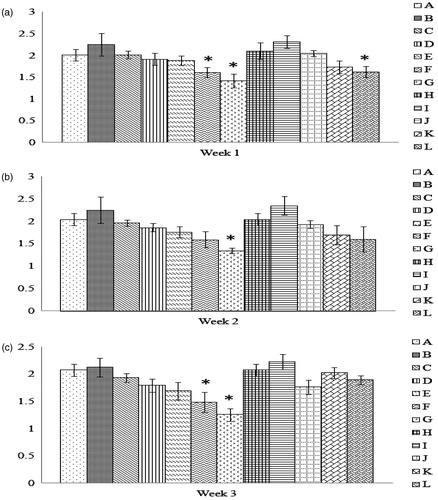
Figure 4. LPS-induced nitrite production by peritoneal macrophages recovered from chicks of hens fed AFB1 ± Vit E for 1, 2, or 3 weeks. Cells were prepared for culture as outlined in the legend for . Lipopolysaccharide (LPS, 1 μg/well) was then added to each well to induce nitrite production over a 24-h period. Culture supernatants were then collected and assessed for nitrite using Griess reagent. Dam on diets for (a) 1 week, (b) 2 weeks, and (c) 3 weeks. Values shown are mean µM nitrite/chick cell culture (±SD); n = 10/group. All groups (A–L) were fed the diets containing various amounts of AFB1 in the presence/absence of Vit E; specific exposure levels for each group are indicated in tables in this paper. Values significantly different from control (Group A chicks) values at *p ≤ 0.05 are indicated.
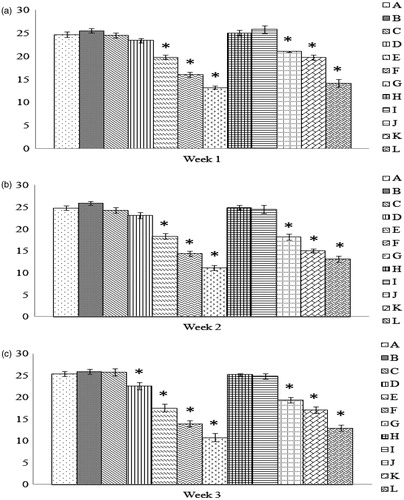
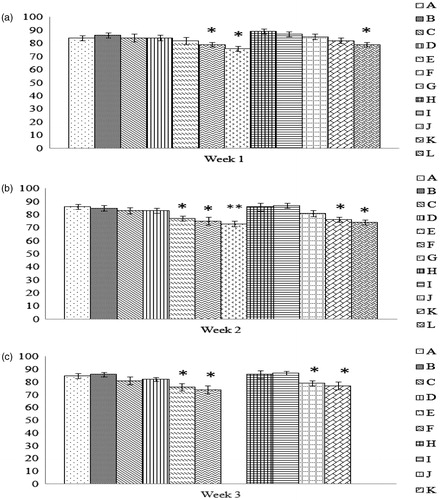
Figure 5. Comparison of rate of hemolysis values. Values shown are for the tim-epoint at which 50% hemolysis was observed using a free radical generator AAPH. All values shown are with RBC obtained from progenies of breeder hens fed AFB1 ± Vit E for (a) 1 week, (b) 2 weeks, or (c) 3 weeks. Values shown are mean ± SD; n = 8/group. All groups (A–L) were fed the diets containing various amounts of AFB1 in the presence/absence of Vit E; specific exposure levels associated with each group are indicated in each table in this paper. Values significantly different from control (Group A chicks) values at *p ≤ 0.05 or **p ≤ 0.01 are indicated. Note: Due to limitations on overall egg production by hens in the 3-week Groups G and L, eggs (and thus progeny) were not available for this particular study.