
Figures & data
Figure 1. A representative black fly (Simulium Himalayas) caught for this study.
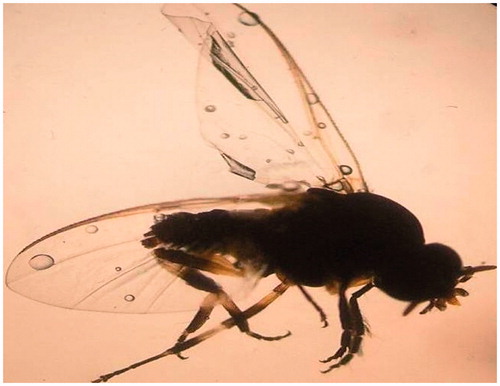
Figure 2. Timecourse of changes in plasma coagulation factor levels in rats injected SC with BFSE (≈800 ng/rat). All factors were assessed by ELISA. Coagulation factor: (a) 1; (b) IX; and (c) X. Each point shown is the mean ± SD. *p < 0.01 versus non-BFSE-injected control; n = 6/group.
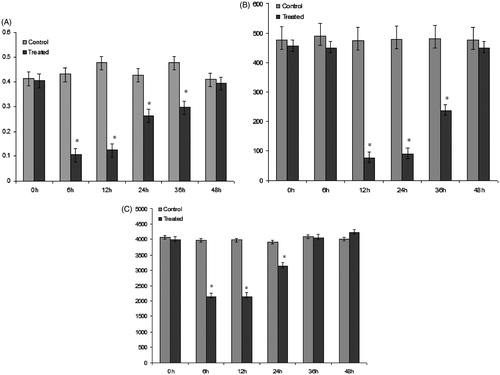
Figure 3. Timecourse of changes in serum levels of key cytokines in rats injected SC with BFSE (≈800 ng/rat). Cytokine levels were determined by ELISA. (a) TNFα. (b) IL-6. (c) IL-10. Each point shown is the mean ± SD. *p < 0.01 versus non-BFSE-injected control; n = 6/group.
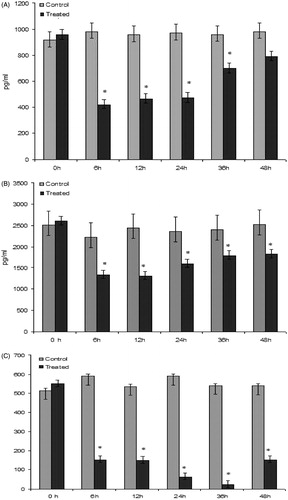
Figure 4. A representative ECG pattern for a Wistar rat. (a) Control rat. (b) Within 6 h after SC injection of BFSE (≈800 ng/rat).
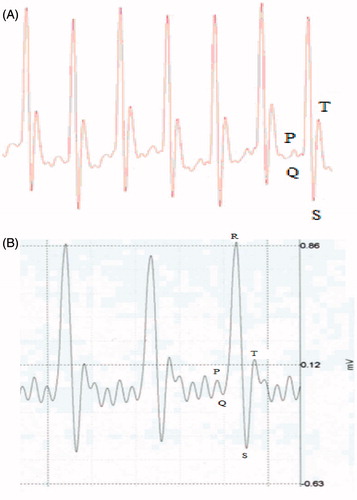
Figure 5. Histopathology of the injection site epidermis 48 h after SC injection of the BFSE (at ≈800 ng/rat). (a, b) Representative tissue samples from control rats showing normal architecture of epidermis with no sign of inflammation, necrosis, or congestion. (c, d) Representative tissue samples from treated rats showing acute, multifocal dermal necrosis, and deposition of fibrin (arrow) (H&E, 100×[a and c] and 1000× [b and d]).
![Figure 5. Histopathology of the injection site epidermis 48 h after SC injection of the BFSE (at ≈800 ng/rat). (a, b) Representative tissue samples from control rats showing normal architecture of epidermis with no sign of inflammation, necrosis, or congestion. (c, d) Representative tissue samples from treated rats showing acute, multifocal dermal necrosis, and deposition of fibrin (arrow) (H&E, 100×[a and c] and 1000× [b and d]).](/cms/asset/43a63682-d3de-472b-814b-535bfbd26bc0/iimt_a_809038_f0005_b.jpg)