Figures & data
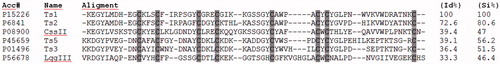
Figure 1. Neutralizing capacity of Serrumab against Tityus serrulatus beta toxins on the cloned mammalian voltage-gated sodium channel 1.3 expressed in Xenopus laevis oocytes. Steady-state activation curves (left panels) and representative whole-cell current traces (right panels) for (a) Ts1 and (b) Ts2: under control conditions (square); with Serrumab alone (star); with 1 µM toxin alone (black ball); and with 1 µM toxin + an equimolar amount of Serrumab (semi-filled diamond). Grey lines indicate traces under control conditions. Voltage dependence data were fitted with a Boltzmann function. The data were tested for their statistical significance using ANOVA, Bonferroni test, p < 0.05 (a) or Kruskal-Wallis, Dunn’s test, p < 0.05 (b).
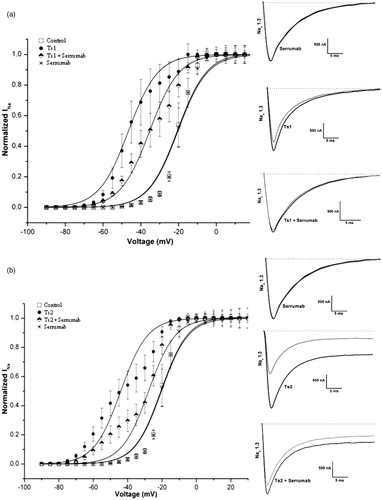
Figure 2. Neutralizing capacity of Serrumab against Tityus serrulatus alpha toxins on the cloned mammalian voltage-gated sodium channel 1.3 expressed in Xenopus laevis oocytes. Steady-state inactivation curves (left panels) and representative whole-cell current traces (right panels) for (a) Ts3 and (b) Ts5: under control conditions (square); with Serrumab alone (star); with 1 µM toxin alone (black ball); and with 1 µM toxin + an equimolar amount of Serrumab (semi-filled diamond). Grey lines indicate traces under control conditions. Voltage dependence data were fitted with a Boltzmann function. The data were tested for their statistical significance using Kruskal-Wallis and Dunn’s test, p > 0.05.
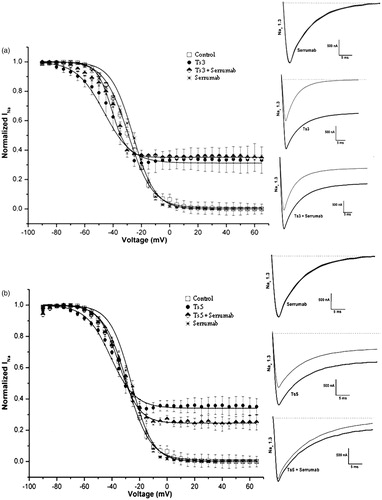
Figure 3. Neutralizing capacity of Serrumab against toxins from the venom of other scorpions on the cloned mammalian voltage-gated sodium (Nav) channels 1.2 and 1.6, as well as on a tipE-encoded insect Nav channel from the cockroach Blattella germanica (BgNav/tipE), expressed in Xenopus laevis oocytes. Steady-state activation and inactivation curves (left panels) and representative whole-cell current traces (right panels) for (a) Centruroides suffusus suffusus toxin II (Css II) on Nav channel 1.6, (b) Leiurus quinquestriatus hebraeus toxin III (Lqh III) on Nav channel 1.2, and (c) Lqh III on the BgNav/tipE channel: under control conditions (square); with Serrumab alone (star); with 1 µM toxin alone (black ball); and with 1 µM toxin + an equimolar amount of Serrumab (semi-filled diamond). Grey lines indicate traces under control conditions. Voltage dependence data were fitted with a Boltz-mann function. The data were tested for their statistical significance using Kruskal-Wallis and Dunn’s test, p < 0.05.
Figure 4. Proportional neutralizing capacity of Serrumab against beta toxins. Bars show percentage of Serrumab neutralization of toxins induced modulation of activation of the channels, quantified by the reduction of the shift in V1/2 of the activation curves (, and ). Inhibition was measured in the mammalian voltage-gated sodium channels 1.3 (for Ts1 and Ts2) and 1.6 (for Centruroides suffusus suffusus toxin II—Css II). The values obtained with the toxin alone were used as the standard (100%). The data are represented as the observed percentage of Serrumab-induced inhibition of toxin activty.
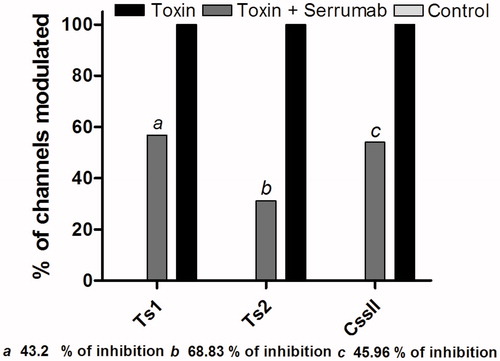
Figure 5. Proportional neutralizing capacity of Serrumab against alpha toxins. Bars show percentage of Serrumab neutralization of toxins induced modulation of the inactivation of the channels, quantified as a reduction in the area under the curve of the inactivation curves (, 2b, 3b, and 3c). Inhibition was measured in the mammalian voltage-gated sodium (Nav) channels 1.3 (for Ts3 and Ts5) and 1.2 (for Leiurus quinquestriatus hebraeus toxin III - Lqh III), as well as in the tipE-encoded insect Nav channel from the cockroach Blattella germanica (also for Lqh III). The control cells inactivation values were used as the control (100%). The data are represented as the observed percentage of Serrumab-induced inhibition of toxin activty.
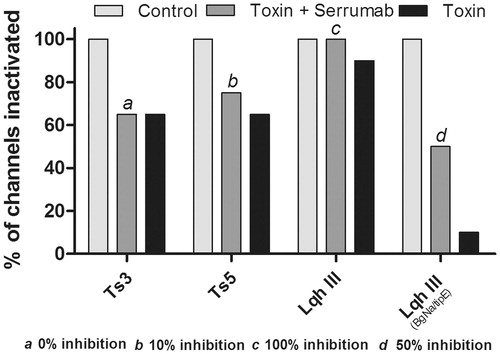
Figure 6. Multiple sequence alignment of long-chain scorpion toxins. The aligment was performed with six sequences. Swiss-Prot accession numbers (Acc#) are followed by the names. Cysteine residues are highlighted in grey. Percentages of identity (Id%) and similarity (Si%) were calculated on the basis of the Ts1 sequence, which was taken as 100%. The aligment was performed with the ClustalW2 multiple sequence alignment tool.