Figures & data
Figure 1. Drinking water volumes of C57BL6 mice exposed to tungstate orally. Animal cages included water bottles with graduated markings. Daily water consumption was recorded and water volumes, as well as tungstate concentrations, adjusted as necessary. There were eight mice per group; error bars represent ± standard error (SE).
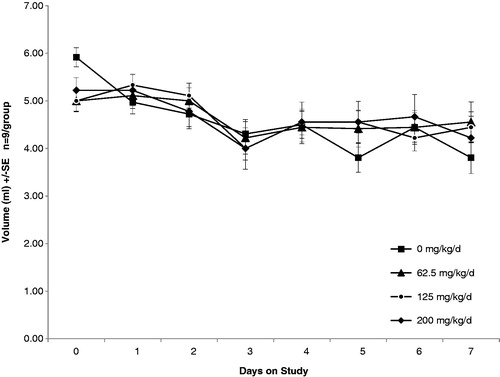
Figure 2. Weights of mice exposed to tungstate. Male and female mice were placed in cages and provided various doses of tungstate in their drinking water. Body weights were monitored during the course of exposure. Open symbols, male; closed symbols, female. Doses indicated by Circle = 0 mg/kg/day, square = 2 mg/kg/day, diamond = 62.5 mg/kg/day, X = 125 mg/kg/day, triangle = 200 mg/kg/day. (A) Mice exposed for 28 days. Values shown are mean ± SE of 11–12 mice/timepoint/sex. (B) Parental mice exposed for 12 weeks before mating, followed by gestation, birth, and weaning. Values shown are mean ± SE of 6–8 mice/timepoint/sex. (C) F1 mice (offspring) exposed after weaning for 12 weeks. Values shown is mean ± SE of 6–8 mice/timepoint/sex.
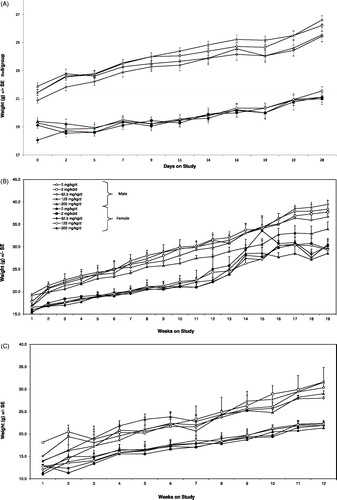
Figure 3. Complete blood counts and hematological parameters of one-generational exposures. A portion of anti-coagulated whole blood from tungstate exposed mice was analyzed by a Hemavet 950 (Drew Scientific) within 4 h of necropsy. Significant differences between generations were very limited; therefore, CBC data for the P and F1 generations were combined for clarity. All parameters use the left axis, with the exception of PLT. Each bar represents the mean ± SE of 11–12 mice/parameter. White blood cell K/µl (WBC), hemoglobin g/dL (HB), mean corpuscular HB concentration g/dL (MCHC), mean platelet volume fL (MPV), lymphocyte K/µl (LY), monocyte K/µl (MO), neutrophil K/µl (NE), eosinophil K/µl (EO), basophil K/µl (BA), red blood cell count M/µl (RBC), hematocrit % (HCT), mean corpuscular volume fL (MCV), mean corpuscular HB pg (HCB), red cell distribution width % (RDW), percent lymphocyte (%LY), percent monocyte (%MO), percent neutrophil (%NE), percent eosinophil (%EO), percent basophil (%BA), platelets K/µl (PLT).
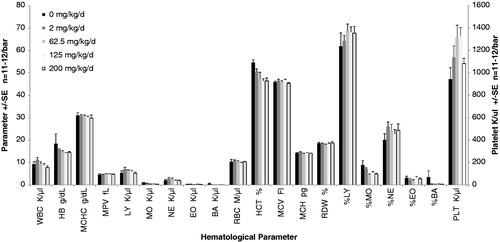
Figure 4. T-Helper (TH) cell quantities and CD71+ TH cells in spleens of mice exposed to tungstate. Mice were exposed to tungstate for either 28 days (A, B) or 12–19 weeks in a one generational (C–E) model. Bars are the mean ± SE of 11–12 mice in the 28-day study and six mice in the one-gen exposure. (A) Quantities of CD3+CD4+ cells in spleens 24 h after challenge with saline or Staphylococcal enterotoxin B (SEB; 20 µg/mouse). (B) Quantities of TH cells that are CD71+ in spleens 24 h after challenge with saline or SEB. (C) Quantities of CD3+CD4+ cells in spleens 24 h after challenge with SEB in parental (P) or first filial (F1) groups. (D) Quantities of CD3+CD4+ and CD71+ cells in spleens 24 h after challenge with saline in P or F1 groups. (E) Quantities of CD3+CD4+ and CD71+ cells in spleens 24 h after challenge with SEB in P or F1 groups. *p < 0.003, **p < 0.001.
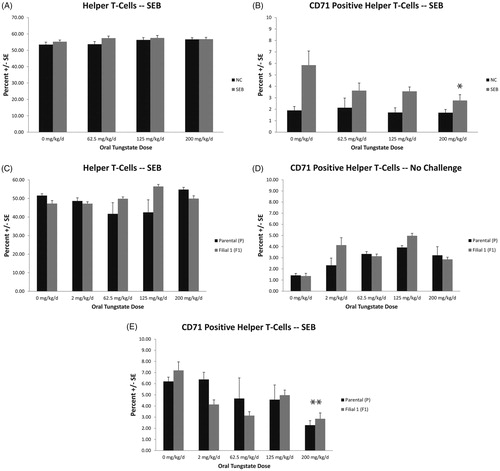
Figure 5. Cytotoxic T (TCTL) cell quantities and CD71+ TCTL cells in spleens of mice exposed to tungstate. Mice were exposed to tungstate for either 28 days (A, B) or 12–19 weeks in a one generational (C–E) model. Bars are the mean ± SE of 11–12 mice in the 28-day study and six mice in one-gen exposure. (A) Quantities of CD3+CD8+ cells in spleens 24 h after challenge with saline or Staphylococcal enterotoxin B (SEB; 20 µg/mouse). (B) Quantities of TCTL cells that are CD71+ in spleens 24 h after challenge with saline or SEB. (C) Quantities of CD3+CD8+ cells in spleens 24 h after challenge with SEB in parental (P) or first filial (F1) groups. (D) Quantities of CD3+CD8+ and CD71+ cells in spleens 24 h after challenge with saline in P or F1 groups. (E) Quantities of CD3+CD8+ and CD71+ cells in spleens 24 h after challenge with SEB in P or F1 groups. *p < 0.001, **p < 0.001.
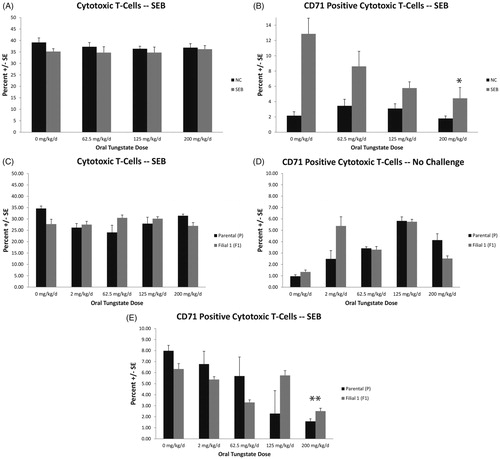
Figure 6. In situ IFNγ production by SEB-activated T-cells from tungstate-exposed mice. Mice were exposed to tungstate for either 28 days or 12–19 weeks in a one generational exposure. IFNγ quantities in isolated plasma were measured by standard ELISA methods. (A) IFNγ in plasma 24 h after SEB or saline challenge. (B) IFNγ in plasma of P and F1 generations 24 h after SEB or saline challenge. All values shown are mean ± SE from six mice/indicated group. *p < 0.001 versus control, **p < 0.001 versus control.
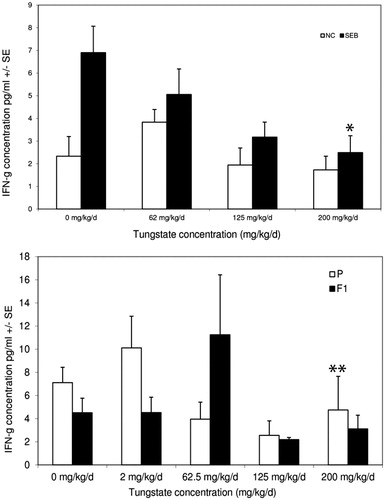
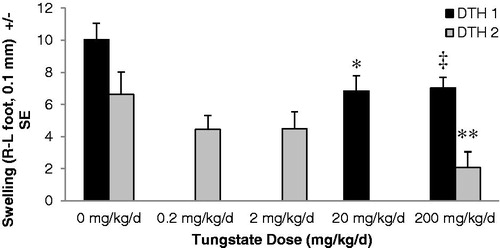
Figure 7. Tungstate-dependent immune suppression in a delayed-type hypersensitivity model. Mice were exposed to tungstate in their drinking water for 28 days prior to the initiation of primary and secondary immune responses with NP-O-Su. The left footpad received saline injection, and the right footpad immunogen. Twenty-four hours after secondary challenge, footpad thickness was measured using dial gauges. The difference between left and right footpad thickness for each mouse was calculated and plotted; each bar represents the mean ± SE of eight mice. DTH1 and DTH2 represent separate DTH experiments with only the control and 200 mg/kg/day doses being in common between the mice. *p < 0.017 versus control (DTH1), ‡p < 0.013 versus control (DTH1), **p < 0.029 versus control (DTH2).