Figures & data
Table 1. Fiber summary for Libby 6-Mix and intermediate chrysotile samples.
Figure 1. Amphibole asbestos increased the frequency of positive ANA tests. The presence of positive ANA tests was evaluated by indirect immunofluorescence on commercially-prepared slides. One mouse of seven (14.1%) exposed to saline was determined to be ANA+; two mice exposed to chrysotile were ANA+ (20%); eight mice exposed to 6-Mix were ANA+ (72.7%). n = 7–11. *Value significantly different compared to saline value using a chi-squared test (p < 0.05).
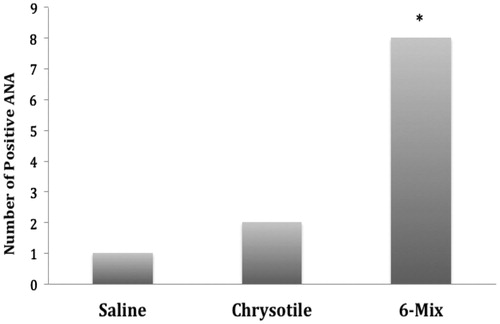
Figure 2. Graphical representation of frequency of autoantibodies to specific ENA antigens. ENA autoantibodies were evaluated by Multi-parameter screening ELISA using samples from the ANA+ mice from . Several mice had multiple ENA specificities in the serum. This graph shows the frequency of different ENA antibodies in each treatment group. Data indicate that patterns of ENA specificities seem to be similar for the two fiber treatments.
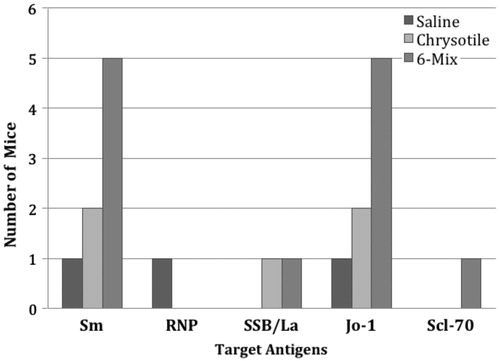
Figure 3. Exposure effects on serum IgG1 levels. Immunoglobulin sub-types were evaluated by mouse isotyping bead array. (a) No significant differences in any isotypes or sub-types except IgG1 were seen. (b) IgG2/IgG1 ratios. Error bars = SEM; *Value significantly different compared to saline value (p < 0.05).
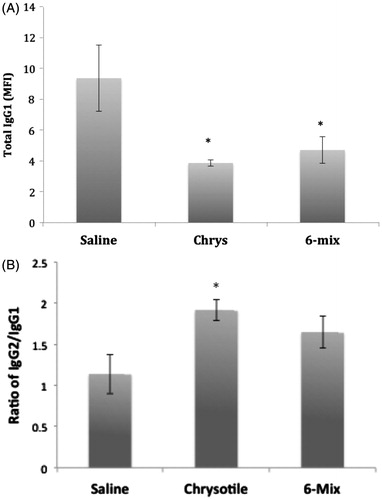
Figure 4. Lymphocyte sub-sets in spleen and lungs of mice treated with saline, chrysotile, and 6-mix and then examined after 8 months. Percentages of key lymphocyte subsets in spleen and lungs of mice were evaluated by multi-color flow cytometry. All data are shown as percentages of gated lymphocytes (based on forward- and side-scatter). Error bars = SEM; n = 7–11. *Value significantly different compared to saline value (p < 0.05).
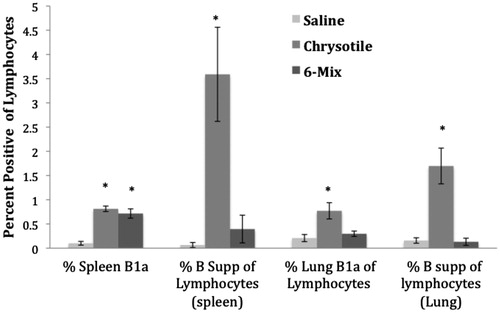
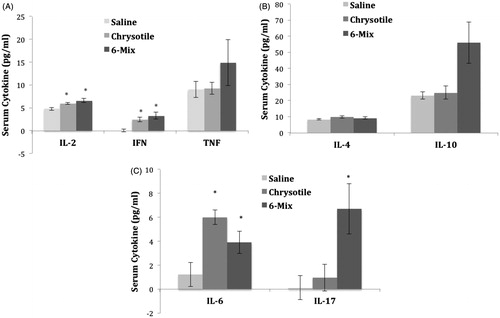
Figure 5. Induced changes in TH1, TH2, and/or TH17 cytokines. Cytokines attributed to the different T-helper cell responses were evaluated using the mouse TH1/TH2/TH17 Cytokine Bead Array (BD Biosciences). (a) TH1, (b) TH2, and (c) TH17 cytokines. Error bars = SEM. *Value significantly different compared to saline value (p < 0.05), for each individual cytokine.