Figures & data
Figure 1. Growth inhibitory effect of RB. Effects of a 24 h RB (1–300 µM) treatment on AGS and NIH 3T3 cell growth were determined using MTT. Results are shown as mean ± SEM (n = 3 per dose/cell line). p Values for extent of inhibition versus untreated control: **p < 0.01, and ***p < 0.001.
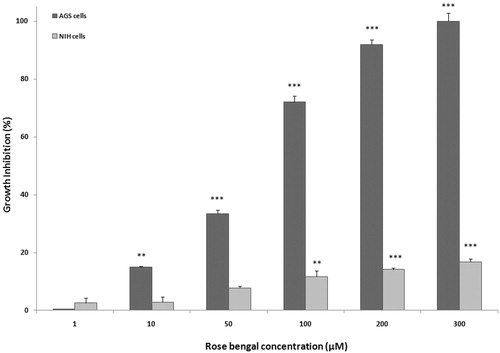
Figure 2. Apoptosis induced by RB in AGS cells. (a) AGS cells were treated with different concentrations of RB (1–300 µM) for 24 h, collected and stained with Annexin V-FITC and PI, and then assessed by flow cytometry. In representative dot-plots from each treatment, the x-axis indicates Annexin-V+ cells and the y-axis PI+ cells. (b) Percentages of early apoptotic, late apoptotic, and necrotic cells among all AGS cells at the different RB concentrations. **p < 0.01 and ***p < 0.001.
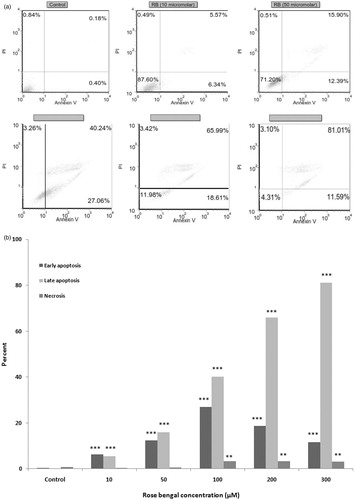
Figure 3. Effect of RB on J774A.1 macrophage viability. Effect of 24 h RB (1–300 µM) treatment on J774A.1 viability was determined using an MTT assay. Results are shown are mean ± SEM (n = 3 per dose). p Values were calculated in comparison to untreated control: *p < 0.05 and **p < 0.01.
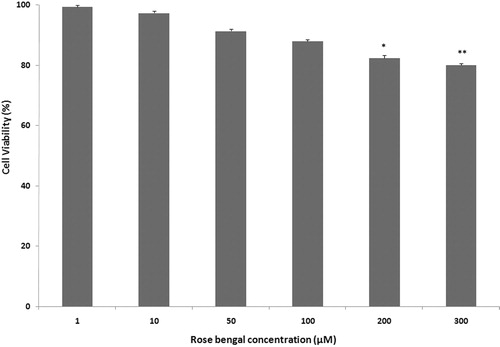
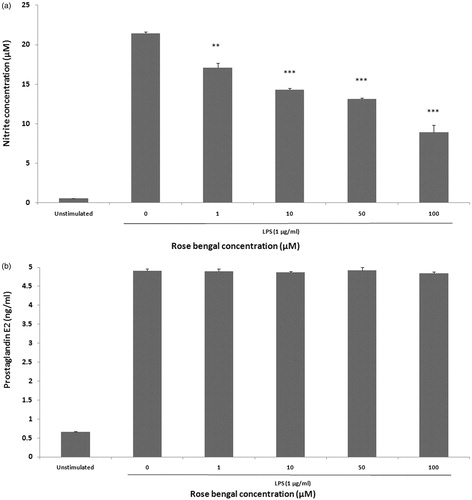
Figure 4. Evaluation of NO and PGE2 production by J774A.1 macrophages. (a) NO and (b) PGE2 production was evaluated after the cells were stimulated for 24 h with LPS alone or in combination with RB (1–100 µM). Results are shown as mean ± SEM (n = 3 per dose). **p < 0.01 and ***p < 0.001 compared to LPS-stimulated macrophages without RB.
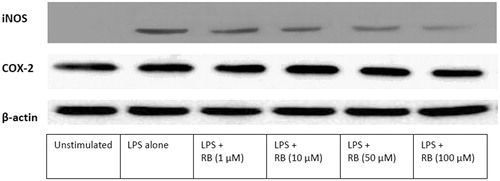
Figures 5. Effect of RB on LPS-induced iNOS and COX-2 expression in J774A.1 macrophages. Lysates were prepared from control or macrophages incubated for 24 h with LPS alone (1 μg/ml) or in combination with RB (1, 10, 50, or 100 μM). A representative Western blot is shown.