Figures & data
Table 1. Mortality of broiler chicks administered orally various doses of chlorpyrifos.
Table 2. Relative weights (% of BW) of organs from chicks given daily oral doses of CPF.
Table 3. Anti-SRBC titers in chicks given daily oral doses of CPF.
Table 4. Anti-Newcastle disease vaccine titres in chicks given daily oral doses of CPF.
Table 5. Lymphoproliferative response (mm) in chicks given daily oral doses of CPF.
Table 6. In vivo phagocytic response (OD increase %; carbon clearance assay) in chicks given daily oral doses of CPF.
Table 7. Histologic changes in bursa of Fabricius, spleen, and thymus due to oral CPF dosing.
Figure 1. Bursa of Fabricius of broiler chick administered chlorpyrifos (20 mg/kg BW) at post-treatment Day 15. Representative photomicrograph shows vacuolar degeneration (arrow heads), proliferation of fibrous connective tissue between lymphoid follicles (arrows), and follicles depleted from lymphoid tissue (D). H&E stain. Magnification = 200×.
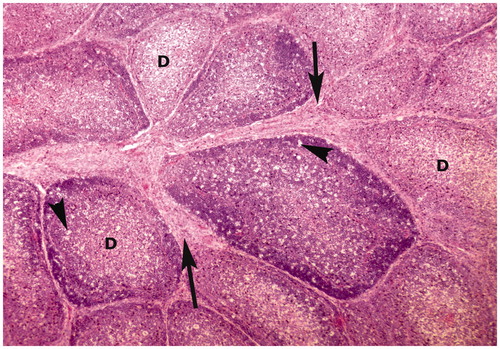
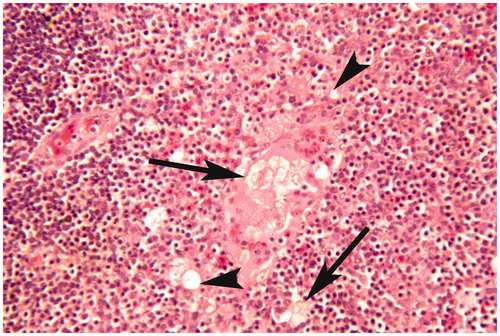
Figure 2. Bursa of Fabricius of broiler chick administered chlorpyrifos (20 mg/kg BW) at post-treatment Day 15. Representative photomicrograph shows necrosis of follicle in the center, edema in the follicle (arrow heads), and proliferation of fibrous connective tissue around the lymphoid follicles (arrows). H&E stain. Magnification = 400×.
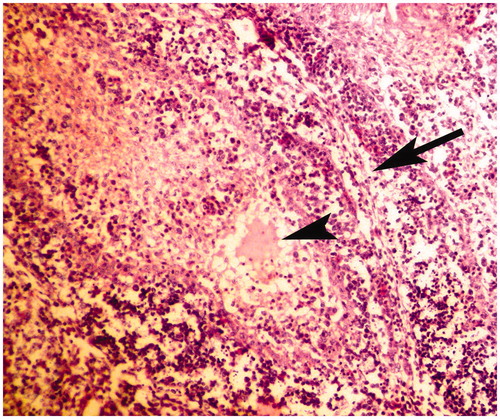
Figure 3. Bursa of Fabricius of broiler chick administered chlorpyrifos (20 mg/kg BW) at post-treatment Day 15. Representative photomicrograph shows fragmentation of nuclei (apoptotic changes) in lymphoid follicle (arrows). H&E stain. Magnification = 400×.
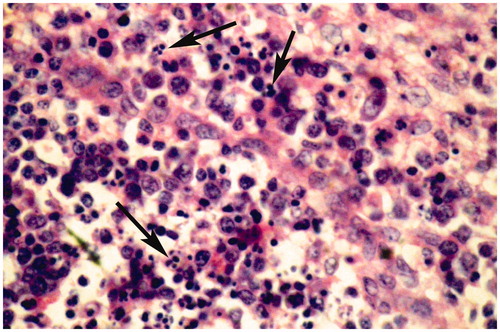
Figure 4. Spleen of broiler chick administered chlorpyrifos (10 mg/kg BW) at day 15 of treatment. Representative photomicrograph shows congestion and degenerative changes. H&E stain. Magnification = 40×.
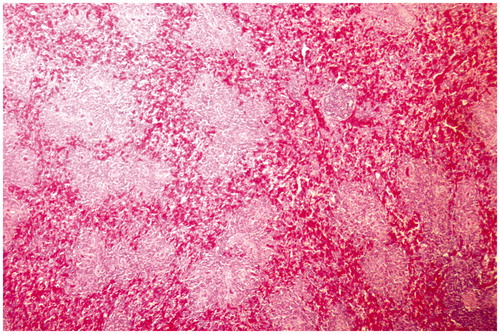
Figure 5. Spleen of broiler chick administered chlorpyrifos (20 mg/kg BW) at post-treatment Day 15. Representative photomicrograph shows congestion and fragmentation of nuclei (apoptotic changes) (arrows). H&E stain. Magnification = 400×.
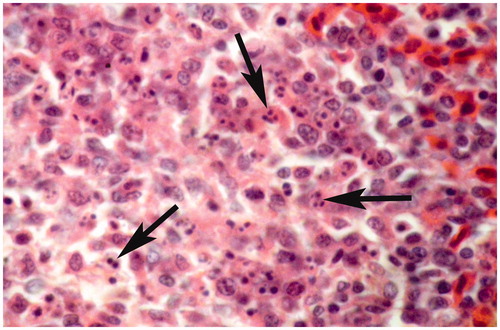
Figure 6. Thymus of broiler chick administered chlorpyrifos (10 mg/kg BW) at day 15 of treatment. Representative photomicrograph shows congestion and degenerative changes. H&E stain. Magnification = 40×.
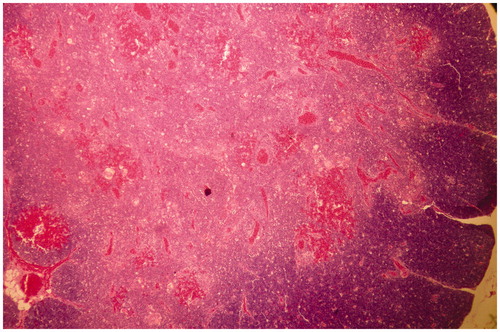
Figure 7. Thymus of broiler chick administered chlorpyrifos (20 mg/kg BW) at post-treatment Day 15. Representative photomicrograph shows hyper-cellularity along with immature monocytes in the medullary region, and necrosis of myoid cells (arrows). H&E stain. Magnification = 100×.
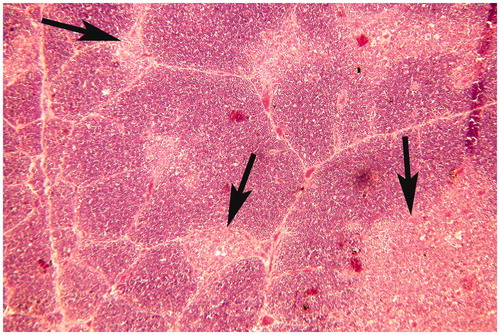
Figure 8. Thymus of broiler chick administered chlorpyrifos (20 mg/kg BW) at post-treatment Day 15. Representative photomicrograph shows condensed nuclei, vacuolar degeneration (arrow heads), myoid cells necrosis, and perforation of myoid cells (arrows). H&E stain. Magnification = 400×.