Figures & data
Table 1. Effects of simulated gastric juice and bile salt on LAB strains, and Caco-2 cell adherence activity.
Table 2. Percentage AFM1 removal in PBS by the presence of LP.
Table 3. Absolute body weight, percentage weight gain, and spleen and thymus weights and indices in mice.
Table 4. Effect of LP on total white blood cell levels and leukocyte differentials in mice.
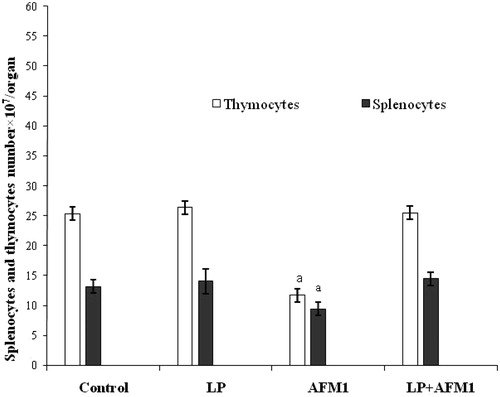
Figure 1. Changes in spleen and thymus cellularity. Mice were orally exposed daily to AFM1 (100 mg/kg BW), LP (109 CFU/L, ∼1 mg/kg BW), or AFM1 + LP for 15 days. Controls received vehicle only each day. Data shown are mean (±SD). aValue significantly different from vehicle control (p < 0.05).