Figures & data
Figure 1. Cadmium content in blood, lungs, spleen, kidneys, and liver of rats. Values represent tissue Cd content 48 h after single IP treatment. Data presented as mean (±SD) from at least two independent experiments (n = 4–6 rats/group in each experiment). ^ Significantly differs versus blood value (p < 0.05).
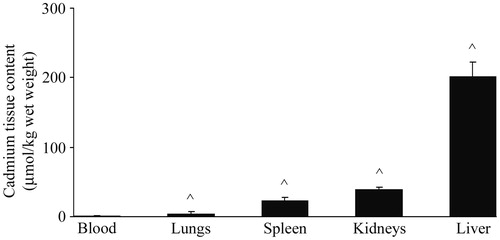
Figure 2. Histology of liver and lungs of rats administered Cd. (A) Representative sample of liver from Cd-treated rat. Left: Rare neutrophils (PMN; arrows) in liver 24 h after Cd dosing. Right: PMN migration to sinusoids (arrows) and intravascular accumulation and aggregation of PMN (insert) at 48 h. (B) Representative samples of lung from the same Cd-treated rats. Top left (48 h): Concentric perivascular mononuclear cell infiltrate. Top right (48 h): Perivascular cell infiltrate (predominantly mononuclear with PMN). Intraluminal PMN. Lower left (24 h): Interstitial inflammatory cells, mainly PMN, with lesser numbers of mononuclear cells. Intraluminal PMN. Lower right (control lungs).
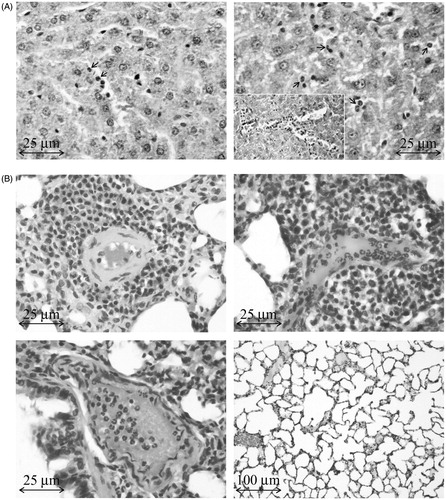
Table 1. Total and differential peripheral blood cell counts.
Table 2. Peripheral blood mononuclear cell CD11b expression.
Figure 3. Effect of Cd on PBMC NO production and iNOS mRNA levels. (A) Spontaneous and LPS stimulated NO production. NO production was analyzed using conditioned medium of mononuclear cells isolated from peripheral blood of control rats (not administered Cd) and rats that received 1 mg Cd/kg. (B) Inducible nitric oxide synthase (iNOS) mRNA expression. Data presented as mean (±SD) from at least two independent experiments (n = 4–6 rats/group in each experiment). mRNA data are expressed as mRNA in PBMC from Cd-treated rats relative to that in cells of control rats. *Value significantly differs from control (p < 0.05). ##Value significantly differs from spontaneous NO production by PBMC from Cd-treated rats (p < 0.01).
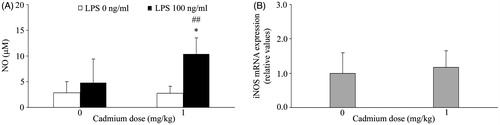
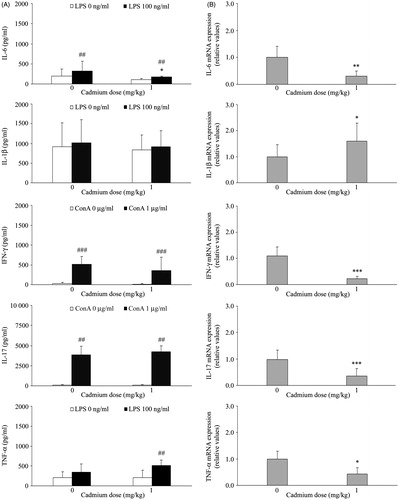
Figure 4. Effect of Cd dosing on PBMC inflammatory cytokine production and expression. (A) Spontaneous (no LPS or ConA), LPS-stimulated (100 ng LPS/ml) production of IL-1β, TNFα, and IL-6, and ConA-stimulated (1 µg ConA/ml) production of IFNγ and IL-17, was analyzed using conditioned medium of mononuclear cells isolated from blood of control rats (not administered Cd) and rats that received 1 mg Cd/kg. (B) Inflammatory cytokine mRNA expression. Data presented as mean (±SD) from at least two independent experiments (n = 4–6 rats/group in each experiment). mRNA data are expressed as mRNA in PBMC from Cd-treated rats relative to that in cells of control rats. Value significantly differs from control (0 mg Cd/kg) at *p < 0.05, **p < 0.01, or ***p < 0.001. Value significantly differs from spontaneous cytokine production by PBMC at ##p < 0.01 or ###p < 0.001.