Figures & data
Figure 1. Venn diagram illustrating number of genes significantly changed by isoflurane (ISO) alone (vs naïve) and by WTC dust exposure (under ISO anesthesia) in rat lungs. ISO by itself changed 1151 genes; when dust was combined with ISO, 1000 genes were changed – of which 232 were in common with ISO, but 166 were due to WTC dust exposure.
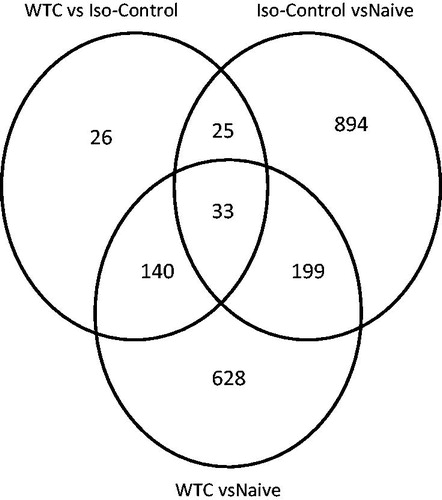
Table 1. Top 30 genes induced in lungs by WTC dust relative to by isoflurane (ISO) only.
Table 2. Top 30 genes inhibited in lungs by WTC dust relative to by isoflurane (ISO) only.
Table 3. Top 30 genes induced by isoflurane (ISO) only in lungs of rats (relative to in naïve rats).
Table 4. Top 30 genes inhibited by isoflurane (ISO) only in lungs of rats (relative to in naïve rats).
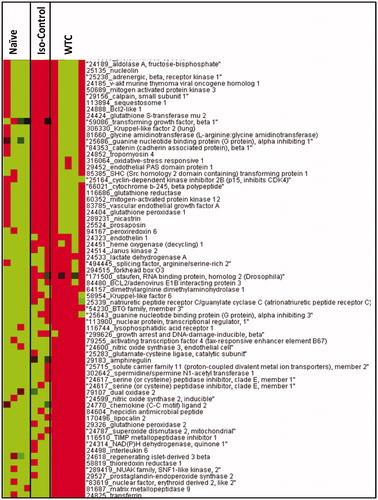
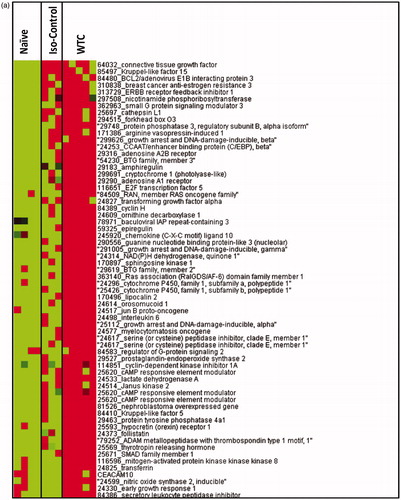
Figure 2. Heat-map for relative expression of genes involved in inflammatory response in naïve rats and those exposed to only ISO anesthesia or WTC dust (under ISO anesthesia). Genes were clustered using Eisen’s Cluster Analysis with median centering and average linkage. Resulting clusters were visualized with Treeview. Red = genes with higher expression values than median; green = genes with lower expression values than median; black = median expression. Gene list was truncated to fit in the figure and for clarity.
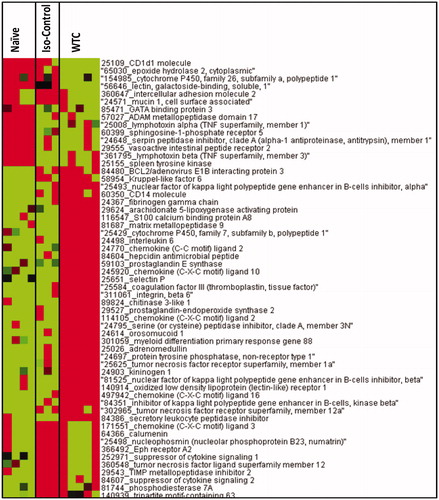
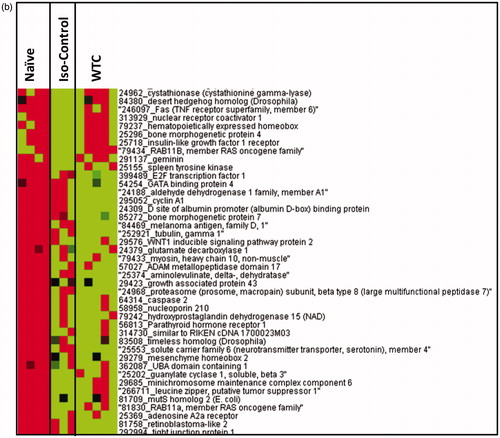
Figure 3. Heat-map for relative expression of genes involved in oxidative stress response in naïve rats and those exposed to only ISO anesthesia or WTC dust (under ISO anesthesia). Genes were clustered using Eisen’s Cluster Analysis with median centering and average linkage. Resulting clusters were visualized with Treeview. Red = genes with higher expression values than median; green = genes with lower expression values than median; black = median expression. Gene list was truncated to fit in the figure and for clarity.