Figures & data
Figure 1. Effect of treatments on blood parameters in mice at various timepoints during the treatment/post-treatment period. (A) Total white blood cell [WBC] count. (B) Hemoglobin [Hb] content. Mice were given a total of 10 daily doses of CTX; every 3 days - starting prior to the first treatment (Day 0) and during/after the treatment (up to 20 days after final treatment) - blood was collected from the tail vein. From this material, total WBC counts and Hb levels were measured. Values shown are mean ± SD. ap < 0.01, bp < 0.05 for CTX only vs CTX/extract- or CTX/MESNA-co-treated. cp < 0.01, dp < 0.05 for normal versus A. ferruginea extract alone.
![Figure 1. Effect of treatments on blood parameters in mice at various timepoints during the treatment/post-treatment period. (A) Total white blood cell [WBC] count. (B) Hemoglobin [Hb] content. Mice were given a total of 10 daily doses of CTX; every 3 days - starting prior to the first treatment (Day 0) and during/after the treatment (up to 20 days after final treatment) - blood was collected from the tail vein. From this material, total WBC counts and Hb levels were measured. Values shown are mean ± SD. ap < 0.01, bp < 0.05 for CTX only vs CTX/extract- or CTX/MESNA-co-treated. cp < 0.01, dp < 0.05 for normal versus A. ferruginea extract alone.](/cms/asset/f8dd0478-c3a9-426f-a1cf-99a895f4a666/iimt_a_914988_f0001_c.jpg)
Figure 2. Effect of treatments on body weight (BW) of mice at various timepoints during the treatment/post-treatment period. Every 3 days - starting prior to the first treatment (Day 0) and during/after the treatment (up to 20 days after the final treatment, i.e. Day 30) - the BW of each animal was measured. ap < 0.01, bp < 0.05 for CTX only versus CTX/extract- or CTX/MESNA-co-treated.
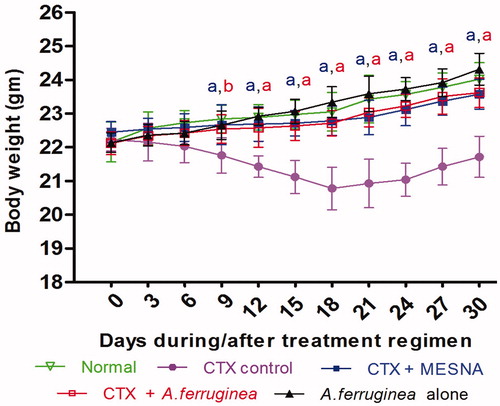
Table 1. Effect of treatments on organ indices on Days 7 and 11.
Table 2. Effect of treatments on bone marrow cellularity and α-esterase activity in mice on Days 7 and 11.
Figure 3. Serum IL-2, IFNγ, GM-CSF, and TNFα after the respective treatments. Serum from the mice euthanized on Days 7 and 11 was assessed for each product by a specific ELISA. Values shown are mean ± SD. ap < 0.01 for CTX only versus CTX/extract- or CTX/MESNA-co-treated. cp < 0.01 for normal versus A. ferruginea extract alone.
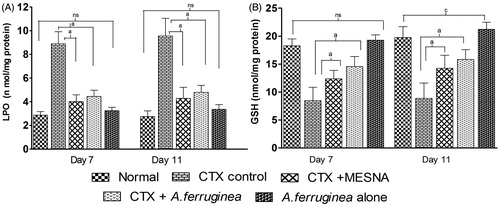
Table 3. Effect of treatments on serum AST, ALT, and ALP in mice on Days 7 and 11.
Figure 4. Bladder LPO and GSH levels after the respective treatments. On Days 7 and 11, six mice from each group were euthanized and their bladders collected. An homogenate was prepared and used for measures of LPO and GSH. Values shown are mean ± SD. ap < 0.01 for CTX only versus CTX/extract- or CTX/MESNA-co-treated. cp < 0.01, dp < 0.05 for normal versus A. ferruginea extract alone.
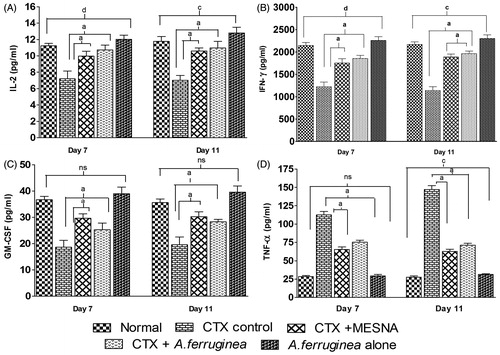
Figure 5. Histology of small intestine due to the treatments. A representative micrograph from a mouse in each regimen is shown. (a) Naïve control showing normal mucosa. (b) CTX only (25 mg/kg BW) showing necrosis with damaged crypt architecture. (c) A. ferruginea extract (10 mg/kg BW) + CTX showing normal muscularis propria. (d) MESNA (25 mg/kg BW) + CTX with randomly damaged architecture. (e) Extract only showing normal architecture. All treatments were by IP injection of each treatment agent daily for 10 consecutive days. In the groups that received CTX or extract only, the volume of any missing component from the co-treatment groups was replaced by gum acacia-PBS injection so that all mice received the same volumes of injection each day. Magnification = 40×.
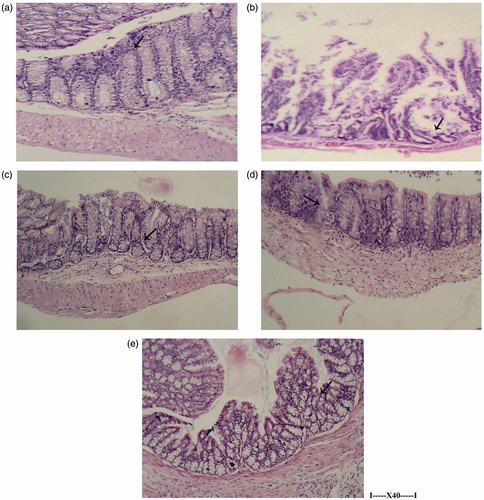
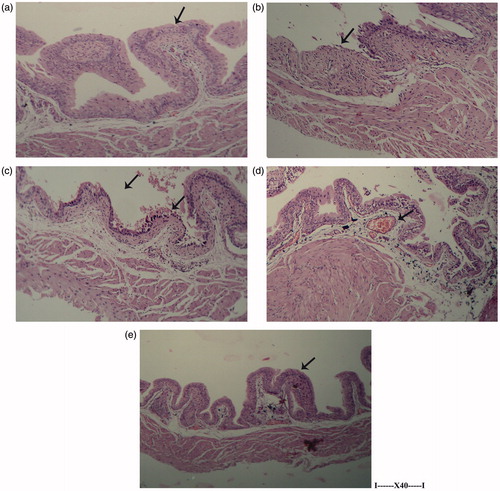
Figure 6. Histology of the urinary bladder due to treatments. A representative micrograph from a mouse in each regimen is shown. (a) Naïve control showing normal epithelium. (b) CTX only (25 mg/kg BW) showing damaged epithelium with edematous area. (c) A. ferruginea extract (10 mg/kg BW) + CTX showing normal lamina propria. (d) MESNA (25 mg/kg BW) + CTX showing normal mucosa. (e) Extract only showing normal architecture. All treatments were by IP injection of each treatment agent daily for 10 consecutive days. In all cases, the volume of any missing component for a given Group was replaced by phosphate buffer saline such that all mice received the same volume of injection each day. Magnification = 40×.