Figures & data
Figure 1. The CRAC channel and T-cell signaling. The figure depicts the relationship between CRAC channel, ORAI1, and cytokine expression in T-cells. The agents used in this study, 2C1.1 and cyclosporin A, are also shown.
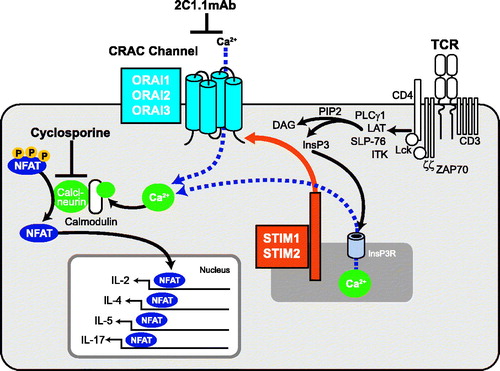
Figure 2. Experimental timeline. Each PD analysis timepoint is indicated relative to dosing and SRBC administration.
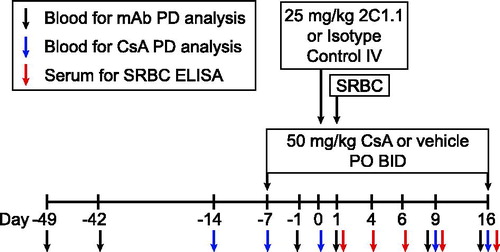
Figure 3. Average CsA plasma concentration (ng/ml) in male Cynomolgus monkeys following repeat oral dose administration. Animals in the CsA group were administered 50 mg/kg PO twice daily from study protocol day −7 to +16. Concentrations were measured following the AM doses on protocol days 0 and 16. Error bars display one standard deviation from the mean plasma concentration. The blue squares represent values from Day 0 of sampling, while the red squares show results from Day 16 samples.
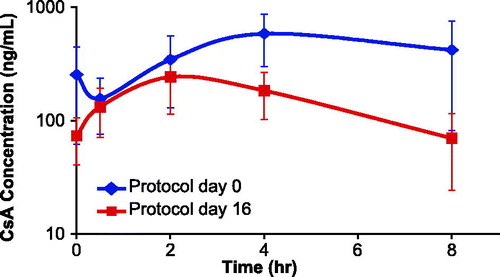
Figure 4. Average 2C1.1 mAb serum concentration (ng/ml) in male cynomolgus monkeys following a single IV dose. Animals in the 2C1.1 group were administered a single IV 25 mg/kg bolus dose on study protocol day 0. Error bars display one standard deviation from the mean plasma concentrations. The dotted line represents the IC50 concentration on iCRAC, as reported in Lin et al. (Citation2013).
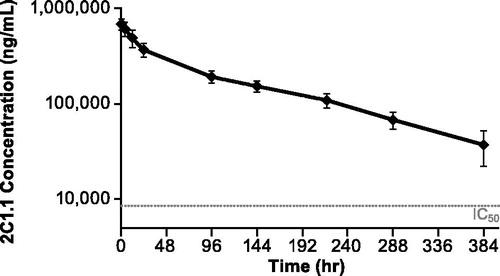
Figure 5. Pharmacodynamic effects of CsA or vehicle on ex vivo PMA + ionomycin-induced cytokines. Cynomolgus monkeys (n = 8/group) were dosed with 50 mg/kg BID CsA or vehicle from day −7 to +16. Blood was collected pre-dose (Days −14 and −7) and post-dose (Days 0, 9, and 16), and stimulated with PMA + ionomycin for 24 h. Supernatants were measured for IL-2, IL-4, IL-5, and IL-17. CsA treatment blocked ex vivo production of PMA + ionomycin-induced (a) IL-2, (b) IL-4, (c) IL-5, and (d) IL-17. Error bars display the standard error of the mean. The gray squares on Days 0, 9, and 16 for each cytokine represent the maximum achievable inhibition, which was determined by spiking in a 10 µM saturating concentration of CsA in vitro.
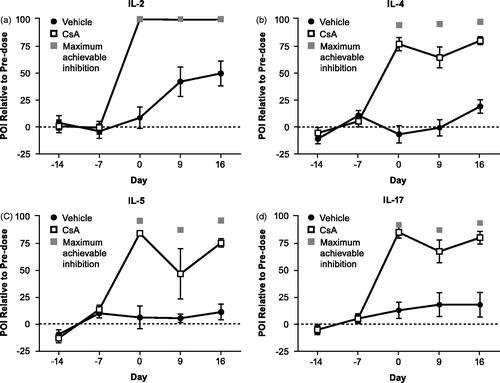
Figure 6. Effects of 2C1.1 or DNP-IgG2 on ex vivo PMA + ionomycin-induced cytokines. Cynomolgus monkeys (n = 8/group) were dosed with 25 mg/kg 2C1.1 or DNP-IgG2 on Day 0. Blood was collected pre-dose (Days −49, −42, and −1) and post-dose (Days 1, 9, and 16), and stimulated with PMA + ionomycin for 24 h. Supernatants were measured for IL-2, IL-4, IL-5, and IL-17. 2C1.1 treatment blocked ex vivo production of PMA + ionomycin-induced (a) IL-2, (b) IL-4, (c) IL-5, and (d) IL-17. Error bars display standard error of the mean. The light gray and dark gray squares on Days 1, 9, and 16 for each cytokine represent the maximum achievable inhibition for 2C1.1 and CsA, respectively, which was determined by spiking in a 0.5 µM saturating concentration of 2C1.1 or a 10 µM saturating concentration of CsA in vitro.
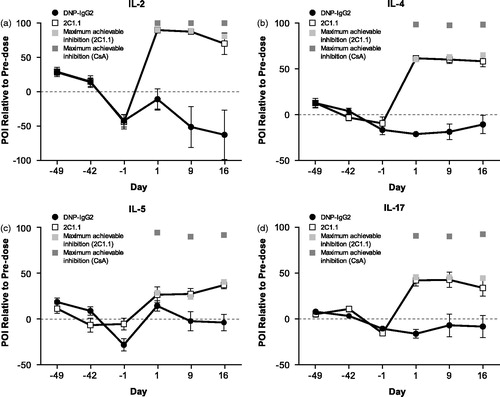
Figure 7. Measurement of target occupancy on T-cells. Cynomolgus monkeys (n = 8/group) were dosed with 25 mg/kg 2C1.1 or DNP-IgG2 on Day 0. Blood was collected pre-dose (on days −42 and −1) and post-dose (Days 1, 9, and 16), and stained with Alexa Fluor 647-labeled 2C1.1. Mean fluorescent intensity (MFI) of the labeled 2C1.1 staining was measured on T-cells by flow cytometry. MFI values obtained from an in vitro spike of unlabeled 2C1.1 were used to calculate maximum target occupancy. Data is graphed as the percentage target occupancy relative to mean of the two pre-dose values and the maximum target occupancy. Error bars display standard deviation from the mean.
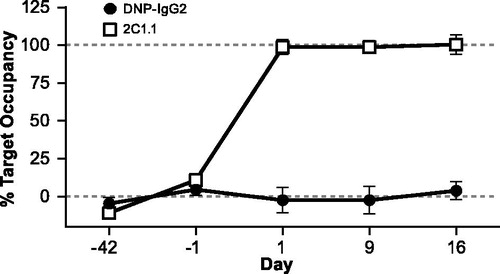
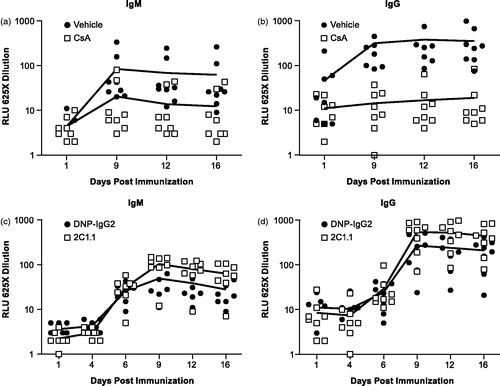
Figure 8. Effects of CsA or 2C1.1 on SRBC-specific IgM and IgG. Cynomolgus monkeys (n = 8/group) were dosed with 50 mg/kg BID CsA or vehicle from Day −7 to +16 and 25 mg/kg 2C1.1 or DNP-IgG2 on Day 0. SRBC was administered on Day 1. Blood was collected post-dose (Days 1, 9, 12, and 16), and serum isolated. SRBC-specific IgM and IgG levels were determined by ELISA, and reported as relative light units (RLU). Data was log-transformed, and a one-way ANOVA was used to compare groups at individual timepoints. CsA treatment resulted in a significant reduction of SRBC specific (a) IgM and (b) IgG on Days 9, 12, and 16 (p ≤ 0.0135). SRBC-specific IgM was reduced by 76–80% relative to vehicle control on Days 9–16. SRBC-specific IgG was reduced by 95–96% relative to vehicle control on Days 9–16. Although animals treated with 2C1.1 trended higher in their SRBC-specific (c) IgM and (d) IgG responses on Days 9, 12, and 16, they did not reach statistical significance. Error bars display the standard error of the mean.