Figures & data
Figure 1. Percentage of Be-responsive T-cells expressing IFNγ. Percentage of Be-responsive T-cells expressing IFNγ (±SE; n = 3) when 100 μM BeSO4 was presented by 1332-EBV presenting cells (black bars) was significantly reduced when either paraformaldehyde-treated 1332-EBV (grey bars; * p < 0.001) or HHKB (white bars; # p < 0.001) cells were used as APC. Percentage of T-cells expressing IFNγ was not significantly different when 1332-EBV cells presented 100 μM BeSO4 compared to 6, 12, 18, or 25 μM Be-ferritin or SEB. T-cell expression of IFNγ was not induced by either Tris-acetate or ferritin (used to generate Be-ferritin adducts). All assays were performed by incubating cells in the presence of stimuli for 60 min and then halting cytokine export by treatment with Brefeldin A and allowing cytokines to accumulate within cells for 5 h prior to fixing.
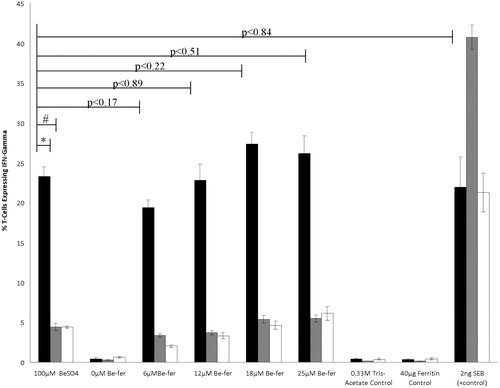
Figure 2. Time-dependent association of beryllium with APC. Association of beryllium with 1332-EBV cells (±SE; n = 3) increases with time. At time 0 and 24 h, there was no statistically significant differences across treatment in the amount of Be associating with cells. At 48 h, the amount of Be associating with cells cultured with 100 μM BeSO4 was higher than with cells cultured with either 10 μM BeSO4 or 10 μM Be-ferritin (*p < 0.019 and p < 0.001, respectively). At 72 h, the amount of Be associating with cells challenged with 100 μM BeSO4 was higher than with cells challenged with 10 μM BeSO4 or 10 μM Be-ferritin (@p < 0.049). The amount of Be associating with cells was not statistically different between the cells in the 100 μM BeSO4 and 50 μM Be-ferritin regimens (p < 0.20).
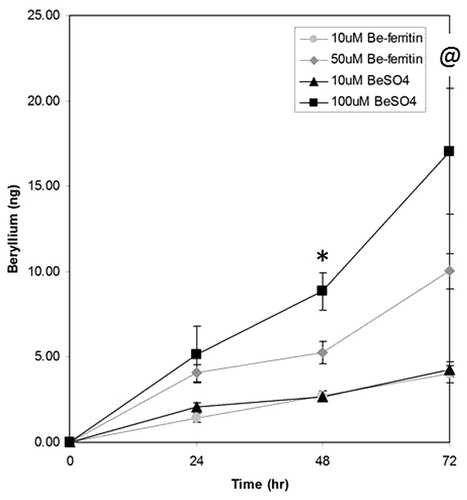
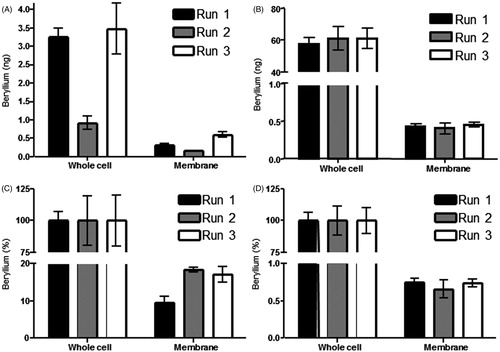
Figure 3. Beryllium association with sub-cellular fractions of APC. All detections were preformed following 72 h incubation. (A) AMS detection of beryllium associated with lysed 1332-EBV whole cells preformed following a 72 h incubation (0.90–3.49 ng) and the membrane fraction (0.17–0.59 ng) of the same APC (n = 3). (B) ICP-MS detection of Be associated with HHKB lysed whole cells following a 72 h incubation (57.68–61.12 ng) and AMS detection of Be associated with membrane fraction (0.40–0.45 ng) of the same APC (n = 3). (C) Amount of Be associated with membrane fraction of 1332-EBV cells as a percentage of total Be associated with the cell following a 72 h incubation (n = 3; 9.59–18.41%). (D) Amount of Be associated with membrane fraction of HHKB cells as a percentage of total Be associated with the cell following a 72 h incubation (n = 3; 0.65–0.75%).