Figures & data
Table 1. Designed primers sequences used in rt-qPCR.
Figure 1. AFB1 detoxification genes expressed in human monocytes, lymphocytes, and HepG2 cells during responses to AFB1. (Upper panel) Four AFB1 detoxification genes and β-actin (ACT-B) mRNA in monocytes (M), lymphocytes (L), and HepG2 cells (H) were measured by RT-PCR. (Lower panel) Comparative transcription of GST-M1 and AKR-7A2 in monocytes and lymphocytes exposed to 10 or 100 ng AFB1/ml for 2 h. All data were normalized to ACT-B internal control. Relative expression level of each gene in control monocytes and lymphocytes was set at 1.0. Data shown are means (±SEM) of cells from four individuals.
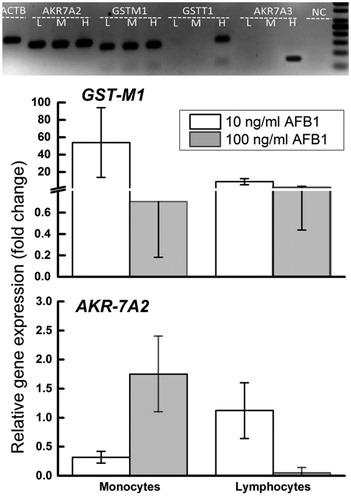
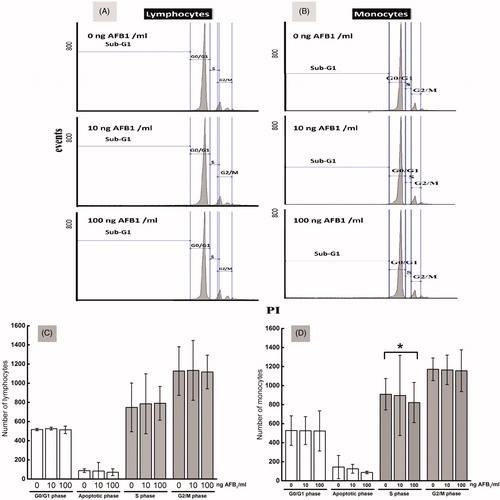
Figure 2. Cell cycle patterns of monocytes and lymphocytes after a 2-h exposure to AFB1. The four representative histograms show the percentages of (A) lymphocytes and (B) monocytes in each cycle phase after exposure to 0, 10, or 100 ng AFB1/ml. All X-axes are in logarithmic scale. Enumeration of the numbers of (C) lymphocytes and (D) monocytes in each cycle phase—G0/G0, sub-G1 (apoptotic cells), G2/M, and S. Open and filled bars are, respectively, geomean events/numbers, and mean events/numbers of leukocytes in 10,000 evaluated cells. Values shown are means (±SEM) of cells from four individuals. **p ≤ 0.05 versus control.