Figures & data
Figure 1. Tumor volumes in treated mice. Values shown are from measures made on Days 0, 4 and 7 of the treatment regimens indicated. Values shown are mean ± SE (n = 6/group). Values significantly different from vehicle control mice at *p < 0.05; **p < 0.01 and ***p < 0.001.
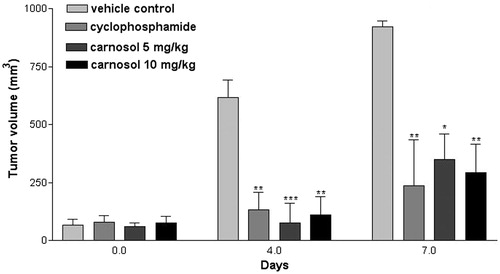
Figure 2. Splenocyte (MNC) proliferation assays. Values shown are from measures made using splenocytes harvested 24 h after the final treatment (harvested on Day 7) from hosts in the indicated regimens. Values shown are mean ± SE (n = 6/group). Values significantly different from vehicle control at **p < 0.01 and ***p < 0.001.
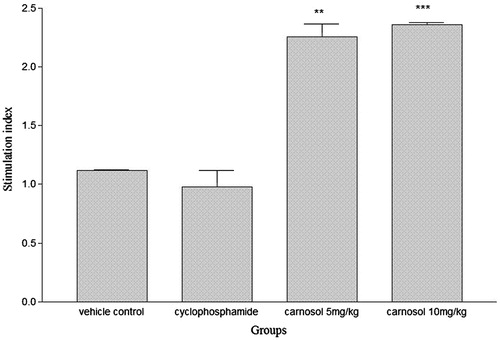
Figure 3. Cytokine formation by isolated splenocytes (MNC). Levels of IFNγ, IL-4, and IL-10 produced after culture of splenocytes harvested 24 h after the final treatment (harvested on Day 7) from hosts in the indicated regimens. Values shown are mean ± SE (n = 6/group). Values significantly different from vehicle control at *p< 0.05 and ***p< 0.001. ###Value significantly different from positive control (p < 0.001).
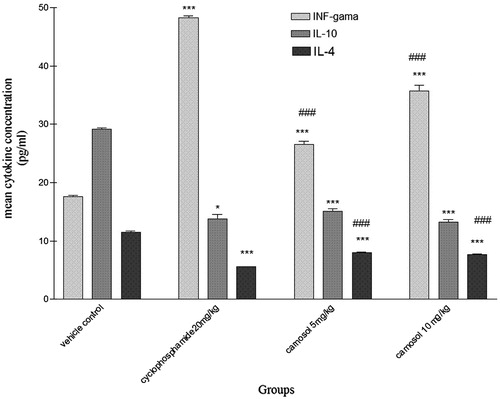
Table 1. Spontaneous cytokine release by splenocytes from mice in treatment groups.
Figure 4. Percentage of intra-tumor and splenic CD4+CD25+FoxP3+ T-cells. Levels of indicated cells among splenocytes/tumor tissues harvested 24 h after the final treatment (harvested on Day 7) from hosts in indicated regimens. All values shown are based on CD4+ cell levels in the sample set as a 100% value. Values shown are mean ± SE (n = 6/group). Values significantly different from vehicle control at *p < 0.05 and ***p < 0.001.
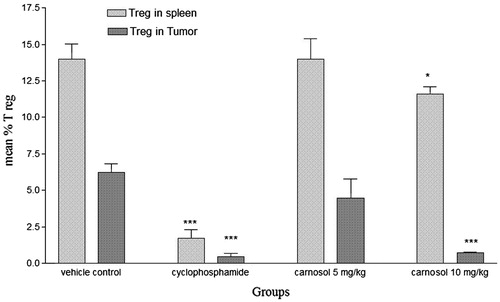
Table 2. Absolute numbers of splenic lymphocyte sub-populations/gram spleen.
Table 3. Absolute numbers of intra-tumor lymphocyte sub-populations/gram tumor tissue.
Figure 5. Percentage of intra-tumor and splenic CD3+ T-cells. Levels of indicated cells among splenocytes/tumor tissues harvested 24 h after the final treatment (harvested on Day 7) from hosts in the indicated regimens. All values shown are based on CD4+ cell levels in the sample set as a 100% value. Values shown are mean ± SE (n = 6/group). Values significantly different from vehicle control mice at *p < 0.05 and ***p < 0.001.
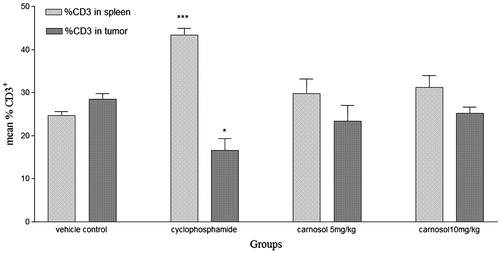
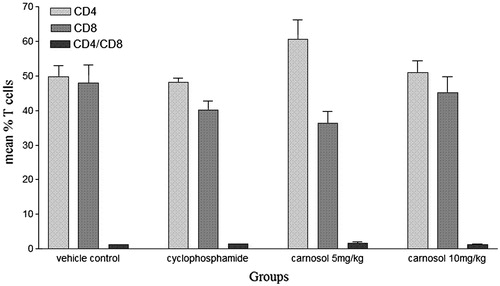
Figure 6. Percentages of CD4+ and CD8+ T-cells and CD4+/CD8+ ratios in spleens. Levels of indicated cells (and calculated ratios) among splenocytes harvested 24 h after the final treatment (harvested on Day 7) from hosts in the treatment regimens indicated. All values shown are based on CD3+ cell levels in the sample set as 100% value. Values shown are mean ± SE (n = 6/group). Values significantly different from vehicle control mice at *p < 0.05.
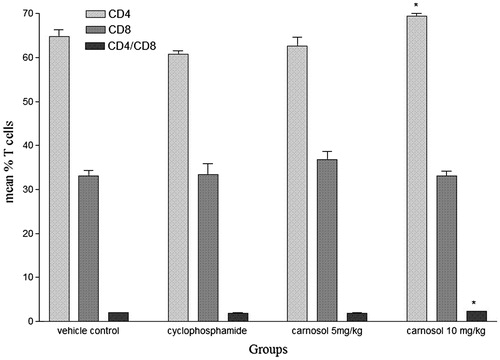
Figure 7. Percentages of CD4+ and CD8+ T-cells and CD4+/CD8+ ratios in tumor samples. Levels of indicated cells (and calculated ratios) among tumor samples harvested 24 h after the final treatment (harvested on Day 7) from hosts in indicated regimens. All values shown are based on CD3+ cell levels in the sample set as 100% value. Values shown are mean ± SE (n = 6/group).