Figures & data
Figure 1. Fluorescence in livers of rats injected with increasing amounts of Bioparticles®. (a) Radiant efficiency of fluorescence in livers following injection of various doses of Bioparticles®. Representative organs are shown. (b) Fold-increase in fluorescence compared to vehicle control (saline).
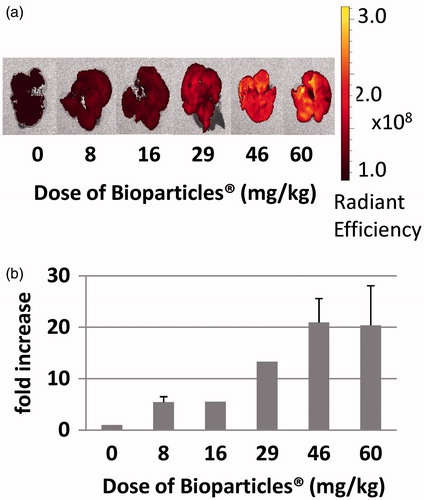
Figure 2. Fluorescence of spleens of rats injected with increasing amounts of Bioparticles®. (a) Radiant efficiency of fluorescence of spleens following injection of various doses of Bioparticles®. Representative organs are shown. (b) Fold-increase in fluorescence compared to vehicle control (saline).
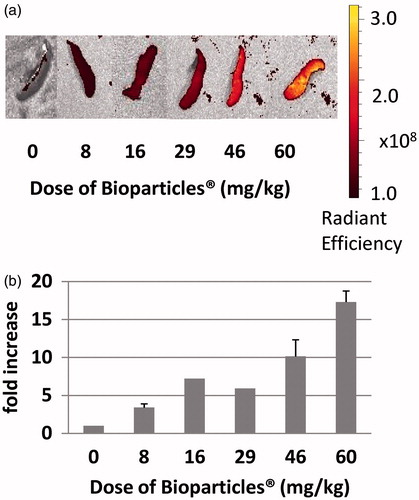
Figure 3. Co-localization of Bioparticles® with liver macrophages. Rats were injected with (a, b) saline or (c–e) 46 mg Bioparticles®/kg. Livers sections were stained with fluorescent antibodies to (a, c, e) ED-1 or (b, d) ED-2. Representative images are shown. Magnification = (a–d) 20× and (e) 40×. Bioparticles® (red); ED-1 and ED-2 (green); nuclei (purple).
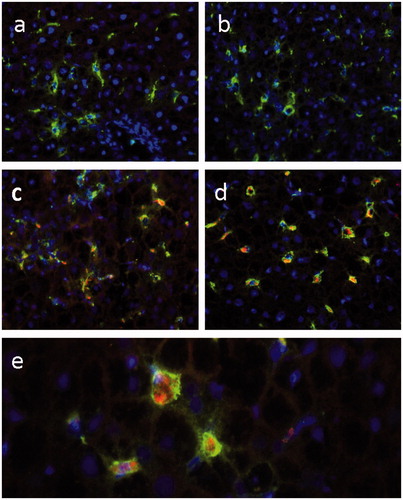
Figure 4. Co-localization of Bioparticles® with spleen macrophages. Rats were injected with (a, b) saline or (c–e) Bioparticles®. Spleen sections were stained with fluorescent antibodies to (a, c, e) ED-1 or (b, d) ED-2. Representative images are shown. Magnification = (a–d) 20× and (e) 40×. Bioparticles® (red); ED-1 and ED-2 (green); nuclei (purple).
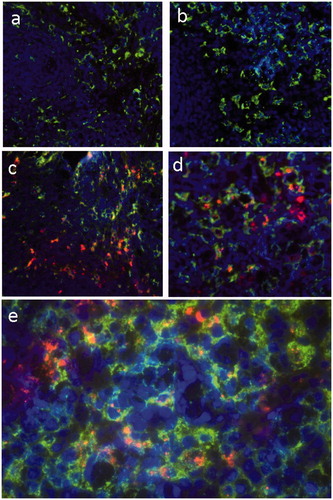
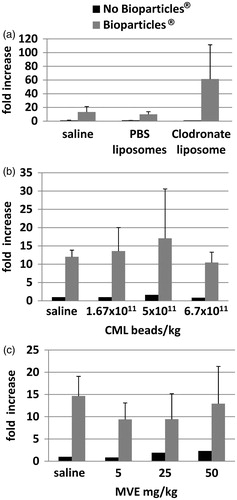
Figure 5. Effect of liposomes, carboxylate modified latex beads, or maleic vinyl ether on phagocytosis in liver macrophages. Rats were injected with (a) liposomes (PBS or Clodronate), (b) CML beads, or (c) MVE prior to injection of the Bioparticles®. Livers were removed and imaged. No Bioparticles® control represent the background fluorescence of livers with saline or test agent only. Fold-increases in fluorescence from (a) PBS liposomes or (b, c) saline controls ± standard deviation are shown. Radiant efficiencies for individual animals were corrected for their liver weights. *p < 0.001 versus Saline + Bioparticles®, p < 0.01 versus PBS liposomes + Bioparticles®; **p < 0.05 versus Saline + Bioparticles®; ***p < 0.01 versus Saline + Bioparticles®; †p < 0.001 MVE versus Saline + Bioparticles®; vp < 0.000 05 versus Saline + Bioparticles®.
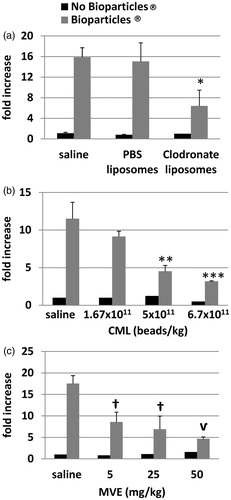
Figure 6. Peripheral blood neutrophil phagocytosis following MPS inhibition. Flow cytometry analysis of blood neutrophils determined the percentage of cells that contained Bioparticles® following MPS inhibition by (a) liposomes, (b) CML beads, or (c) MVE. *p < 0.01 versus Saline + Bioparticles®; †p < 0.000 05 versus Saline + Bioparticles®.
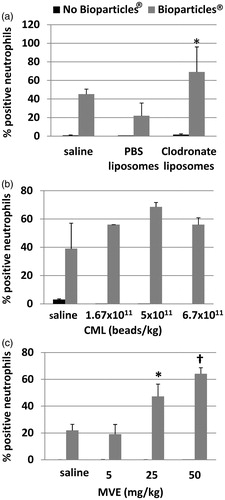
Figure 7. Effect of liposomes, carboxylate modified latex beads, or maleic vinyl ether on phagocytosis in spleen macrophages. Rats were injected with (a) liposomes (PBS or Clodronate), (b) CML beads, or (c) MVE prior to injection of the Bioparticles®. Spleens were removed and imaged. ‘No Bioparticle®’ controls represent background fluorescence of spleens with saline or test agent only. Fold-increases in fluorescence from (a) PBS liposomes or (b, c) saline controls ± standard deviation are shown.