Figures & data
Figure 1. ADMA levels following 4-week exposure to CS. Serum and lungs were collected after 4 weeks of smoke exposure. Serum (A) ADMA and (B) L-arginine levels were determined by LC-MS (control, n = 12; smoke, n = 16). (C) Ratio of L-arginine to ADMA levels in serum. Data shown are means ± SE; *p < 0.001 vs control animals. ADMA levels in lung tissue were visualized using IHC. Lung sections of (D) control and (E) smoke-exposed mice were stained with antibody that recognizes both free and protein-incorporated forms of ADMA. Magnification 40×. Both the LC-MS data and IHC data show elevated ADMA after smoke exposure.
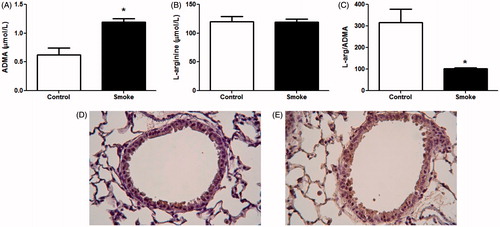
Figure 2. Lung DDAH expression following 4-week exposure to CS. Cell DDAH I and DDAH II expression was visualized by IHC. Lung sections of (A and C) control and (B and D) smoke-exposed mice were stained with antibodies to (A and B) DDAH I or (C and D) DDAH II. Magnification 40×. (E) DDAH I and DDAH II mRNA expression levels were determined in whole lung homogenates of control and smoke-exposed mice using real-time qPCR (control, n = 17; smoke, n = 22). Data shown are means ± SE. *p < 0.05 vs control animals. (F) The amount of DDAH I and DDAH II staining was quantified as the percentage positive (brown) stained vs total cell counterstain (purple) for each field. The data illustrates that DDAH protein levels are lower in CS-exposed mice.
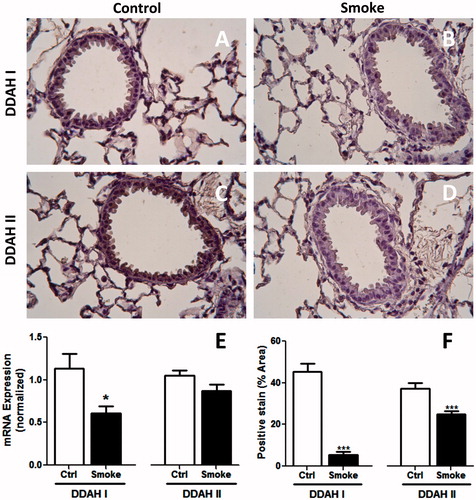
Figure 3. Effects of CSE on DDAH expression in mouse lung epithelial cells in vitro. Cultured LA-4 cells were treated with either fresh or aged (24 h) 10% CSE for 6 h in serum-free media and mRNA expression for (A) DDAH I and (B) DDAH II was determined using real-time qPCR (n = 3/group). Cells were treated with CSE and/or 5 mM NAC for 6 h in serum-free media and mRNA expression for (C) DDAH I and (D) DDAH II was determined using real-time qPCR (n = 4/group). Data shown are means ± SE. *p < 0.05 vs control cells. Fresh CSE decreased DDAH I and II. NAC was able to block this effect.
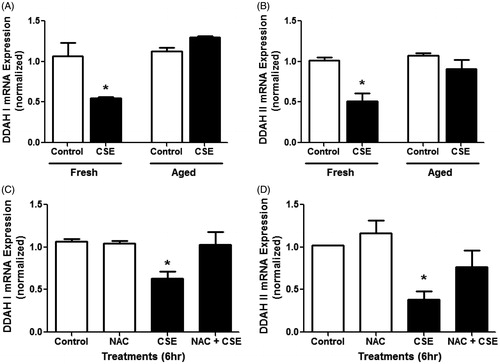
Figure 4. Effects of ADMA and CSE on NF-κB activity and TNFα production in mouse lung epithelial cells. LA-4 cells treated with 100 µM ADMA ±10% CSE in serum-free media for ∼24 h. (A) Relative NF-κB binding activity in nuclear extracts was determined (n = 4/group). (B) TNFα levels in the media were also assessed (n = 4/group). Data shown are means ± SE. *p < 0.05. This data indicates that ADMA in combination with CSE increases both NF-κB activity and TNFα production in vitro.
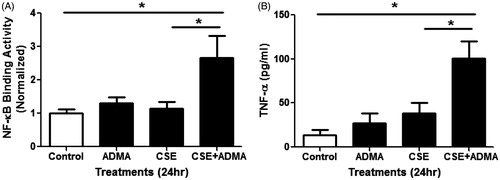
Figure 5. CS-mediated lung inflammation in DDAH transgenic mice. Lung inflammation was assessed in lung tissue. Lung sections of (A and B) wild-type (WT) and (C and D) hDDAh Tg mice were H&E stained, and inflammation was visualized following (A and C) air or (B and D) 4-week CS exposure. Original magnification = 10×; increased magnification = 40×. Total cells in whole lung lavage were counted following (E) 4-week (WT, n = 11–12; DDAH Tg, n = 7–8) and (G) 4 days (WT, n = 6; DDAH Tg, n = 5) smoke exposures. TNFα levels in BAL fluid were also assessed in both the (F) 4-week (WT, n = 8–9; DDAH Tg, n = 7–8) and (H) the 4 day (WT, n = 3–4; DDAH Tg, n = 3) models. Data shown are means ± SE. *p < 0.05 vs WT control, Ψp < 0.05 vs WT smoke.
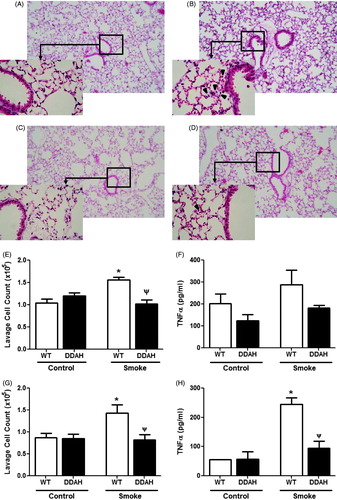
Figure 6. CS-mediated lung lavage nitrate levels in DDAH transgenic mice. Nitric oxide production was measured by nitrite formation in lung lavage fluid. Lung lavage (BAL) of wild-type (WT, n = 9–15) and hDDAh transgenic mice (DDAH Tg, n = 9) was assayed for total nitrite content following cigarette smoke exposure for 4 weeks. The cigarette smoke-induced decrease in nitrite levels was significantly less in DDAH Tg mice compared to WT mice. Data shown are means ± SE. *p < 0.05 DDAH Tg vs WT control.
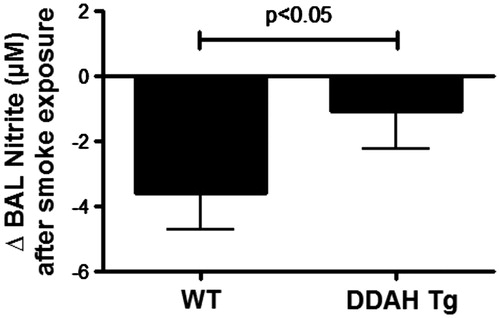
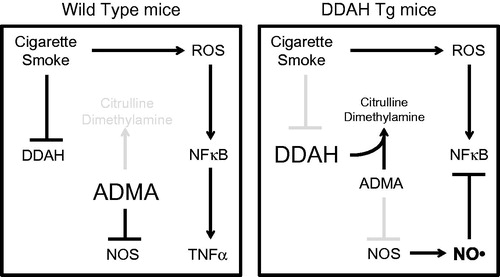
Figure 7. Model for the ADMA/DDAH pathway in CS-mediated inflammation. In this model, CSE reduces DDAH I and II expression in lung epithelial cells, which leads to increased ADMA. Elevated ADMA inhibits NOS, which enhances CS-mediated inflammation allowing for increased NF-κB activity and the release of inflammatory mediators such as TNFα by airway epithelial cells.