Figures & data
Table 1. Gastric juice tolerance and Caco-2 adherence of LAB strains (log cfu/ml).
Table 2. Characterization of bacterial surface—adhesion to solvent (microbial adhesion to solvents method).
Table 3. Percentage AFB1 and AFM1 removal from PBS by LP alone.
Figure 1. Effect of treatments on feed consumption by Balb/c mice. Results shown are mean ± SD. In each histogram, values (bars) with superscripts bearing different letters differ significantly (p < 0.05).
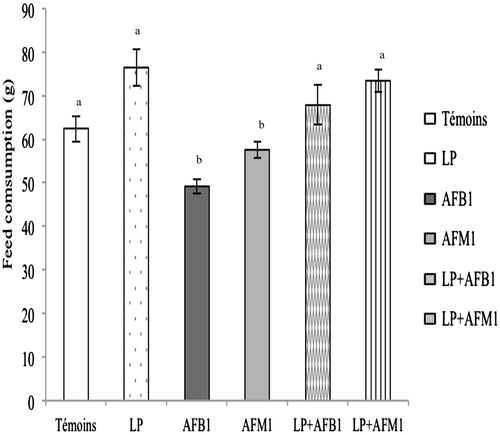
Table 4. Body weight gain and spleen and thymus indexes in the mice.
Figure 2. Thymocyte and splenocyte cell numbers for mice after the 15 days of treatment. Mice were orally exposed to LP (2 × 10⁹ CFU/kg), AFB1 (0.25 mg/kg), AFM1 (0.27 mg/kg) or to a co-treatment with LP + AFB1 or LP + AFM1. Data shown are as mean ± SE. In each histogram, values (bars) for each given type of cellularity with superscripts bearing different letters differ significantly (p < 0.05).
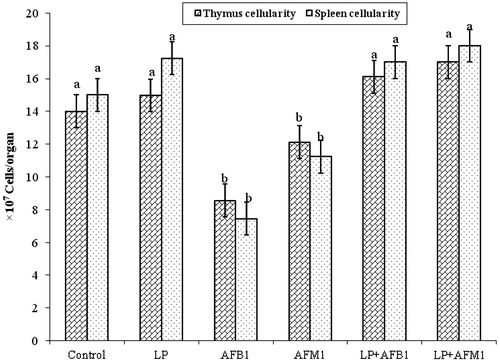
Table 5. Effect of treatments on hematological parameters.
Figure 3. Representative photomicrographs of H&E-strained spleen of mice after the 15 days of treatment. (A and B) Control mice and mice treated daily with LP (2 × 10⁹ CFU/kg). (C and D) Mice treated daily with AFB1 (0.25 mg/kg) or AFM1 (0.27 mg/kg). (E and F) Mice co-treated daily with LP + AFB1 or LP + AFM1. Magnification = 40×. WP, white pulp; RP, Red pulp; MZ, Marginal zone; Mg, Megakaryocyte; L, Lymphocyte; M, Macrophage; N, Neutrophil.
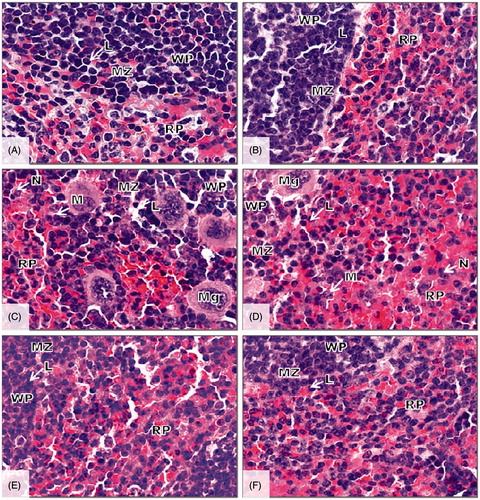
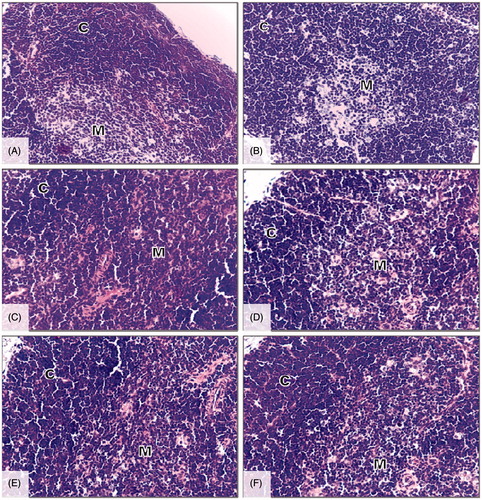
Figure 4. Representative photomicrographs of H&E-strained thymus of mice after the 15 days of treatment. (A and B) Control mice and mice treated daily with LP (2 × 10⁹ CFU/kg bw). (C and D) Mice treated daily with AFB1 (0.25 mg/kg) or AFM1 (0.27 mg/kg). (E and F) Mice co-treated daily with LP + AFB1 or LP + AFM1. Magnification = 40×. C, Cortex; M, medulla.