Figures & data
Table 1. Effect of AFB1 and FB1 on yield of L. paracasei BEJ01.
Table 2. Percentage AFB1 and FB1 removal from PBS by live and killed LAB in PBS.
Figure 1. Splenic indices for mice after treatments. Mice were orally exposed daily for 2 weeks to LAB (2 × 10⁹ CFU/L, ∼2 mg/kg BW), AFB1 (80 µg/kg), FB1 (100 µg/kg), AFB1 + FB1, AFB1 + LAB, FB1 + LAB, or AFB1 + FB1 + LAB. Measures were made after 12 h fasting (i.e. on day after the final treatment in each group). Data shown are mean ± SD. In each histogram, values (bars) with superscripts bearing differ significantly (p < 0.05).
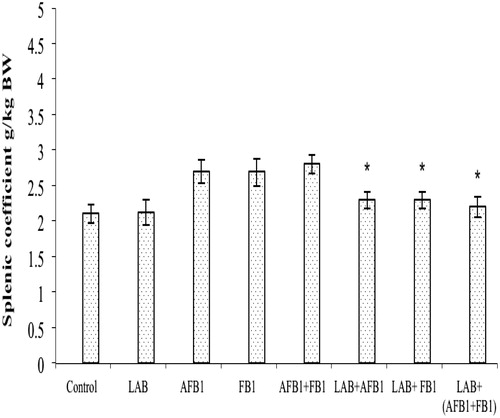
Table 3. Effect of treatments on splenic mRNA expression of select inflammatory cytokines.
Table 4. Effect of treatments on splenic oxidative stress enzymes.
Figure 2. Caspase-3 activity in splenocytes from mice after treatment. Mice treated as indicated in the legend for . Cells were harvested from spleens isolated after hosts were fasted for 12 h (i.e. on day after the final treatment in each group). Data shown are mean ± SD. In each histogram, bars with (*) differ significantly to other treatments (p < 0.05).
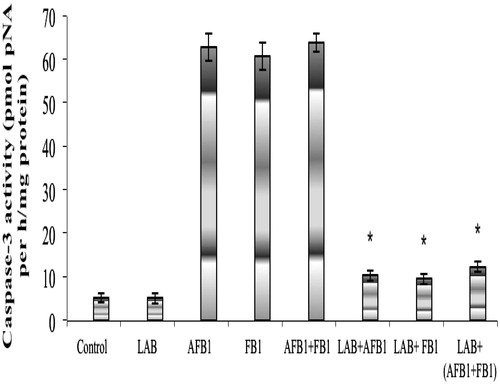
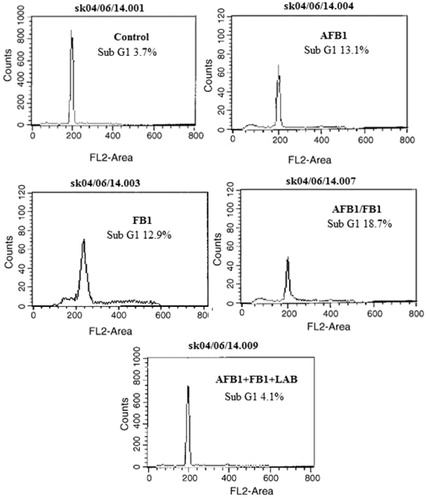
Figure 3. Effect of LAB on AFB1/FB1 induced apoptotic DNA. Freshly-isolated thymocytes (1.5 × 10⁶) from each mouse treated as indicated in the legend for . Propidium iodide fluorescence was measured using a flow cytometer with an FL-2 filter. Results are expressed in each histogram as the percentage of sub-G1 population.