Figures & data
Figure 1. Diabetes incidence and average glycemia levels in NOD females treated with DDE up to 24 weeks-of-age. Mice received DDE at 50 or 25 mg/kg IP biweekly, starting at 8 weeks-of-age; control mice received vehicle. (a) Diabetes incidence presented as fraction of survival, where 1.0 represents 100% diabetes-free; *p < 0.05 (Mantel-Cox log-rank test). (b) Glycemia determined on a weekly basis. Data shown are mean ± SEM; n = 15–30/regimen.
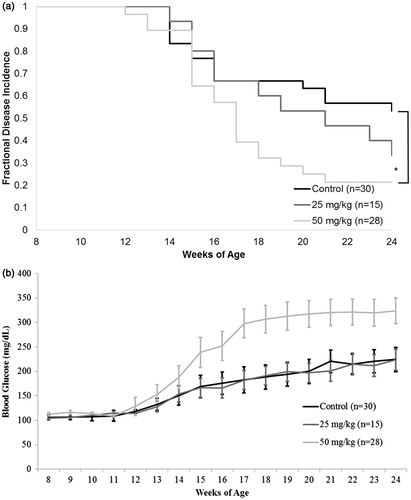
Figure 2. Proliferation and apoptosis among T-lymphocytes following in vitro exposure to DDE. (a) Proliferation was determined by culturing naïve NOD splenocytes (in triplicate) for 72 h in the absence (non-stimulated) or presence (stimulated) of ConA (3 μg/ml) and with addition of 0.39–100 μg DDE/ml. Positive controls consisted of DMSO at the same concentration as in the highest DDE regimen; negative control consisted of complete media only. Data presented as mean ± SEM; *p < 0.05 versus stimulated positive control (Student’s t-test). Figure is representative of four experiments. (b) Apoptosis assessed in splenocytes cultured for 24 h with an addition of 5 or 100 μg DDE/ml; control cultures received DMSO at a concentration found in the 100 μg DDE/ml regimen. Apoptotic events were quantified by flow cytometry; apoptotic and live cells were detected as Annexin V FITC+/PI+ (dead) and Annexin V FITC−/PI− (alive), respectively. Data shown are mean ± SEM of three experiments; *p < 0.05 versus appropriate dead and live groups of cells exposed to 100 μg DDE/ml.
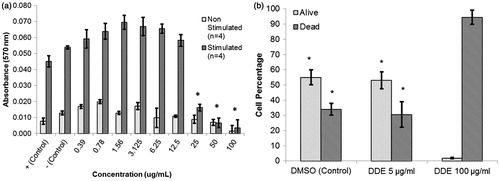
Figure 3. Splenocyte viability after acute treatment of NOD males with DDE. Mice were treated with (a, b) 1 or (c, d) 100 mg DDE/kg (or vehicle) IP every other day for a total of five injections (over 10 days), then euthanized on Day 11. Cell viability was expressed as (a, c) a percentage or (b, d) absolute cell number (×106). Viability was measured using Trypan blue. Data shown are mean ± SEM; n = 9–10/regimen.
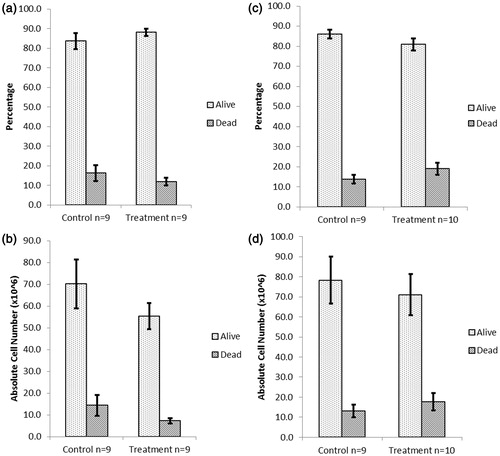
Figure 4. Immunophenotyping of splenocytes isolated from NOD males that underwent acute treatment with DDE. Mice were treated with (a, b) 1 or (c, d) 100 mg DDE/kg (or vehicle) IP every other day for a total of five injections (over 10 days), then euthanized on Day 11. Spleens were removed and single cell suspensions prepared; the cells were then stained with antibodies against the markers CD4 (TH), CD8 (TC), CD3 (T), CD45RB220 (B-cell), CD11b (Mac), NK1.1 (NK) and CD4/CD25 (TReg) and analyzed in a flow cytometer. Data shown are mean ± SEM; n = 6–10/regimen.
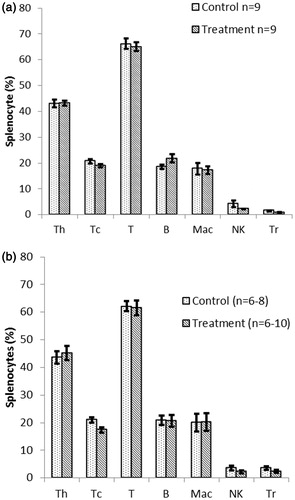
Figure 5. Proliferation by splenocytes (T-lymphocytes) isolated from NOD male mice that underwent acute treatment with DDE. Mice were treated with (a) 1 or (b) 100 mg DDE/kg (or vehicle) as outlined in the legends to and . Proliferation was then determined by culturing splenocytes in the absence (non-stimulated) or presence (stimulated) of ConA (3 μg/ml) for 72 h. Data shown are mean ± SEM; n = 5–10/regimen. *p < 0.05 versus controls (Student’s t-test).
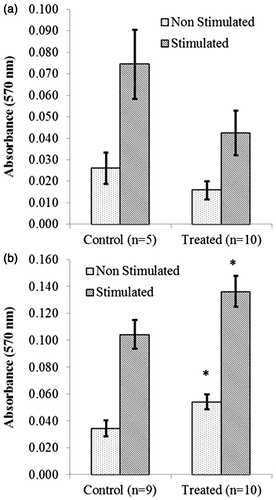
Figure 6. Quantification of cytokine levels after acute treatment of NOD males with DDE. Cytokines acquired from supernatants of splenocytes obtained from mice treated with 1 or 100 mg DDE/kg as outlined in the legends to and . After 48 h of culture in the presence of ConA (3 μg/ml), supernatants were analyzed using a CBA mouse TH1/TH2/TH17 kit that permits quantification of IL-6, TNFα, IFNγ, IL-2, IL-4, IL-10 and IL-17. Data shown are mean ± SEM; n = 3–6/regimen. *p < 0.05 versus corresponding control (Student’s t-test).
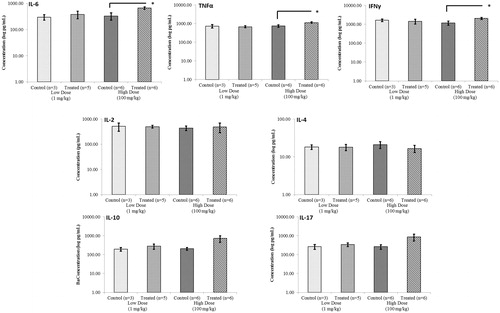
Figure 7. Proliferation by splenocytes (T-lymphocytes) isolated from NOD females that underwent chronic treatment with DDE. Mice were treated for (a) 2, (b) 10 or (c) 16 weeks with 50 mg DDE/kg or vehicle. T-cell proliferation was determined by culturing isolated splenocytes in the absence (non-stimulated) or presence (stimulated) of ConA (3 μg/ml) for 72 h. Data shown are mean ± SEM; n = 7–14/regimen.
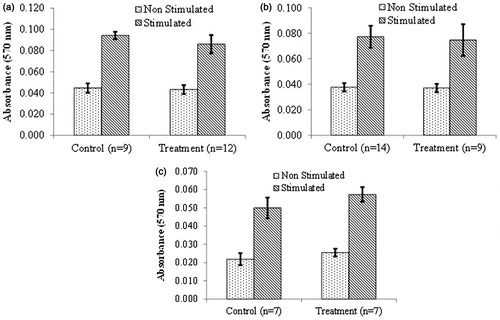
Figure 8. Immunophenotyping of splenocytes recovered from NOD females that underwent chronic treatment with DDE. Mice were treated for (a) 2, (b) 10 or (c) 16 weeks with 50 mg DDE/kg or vehicle. Spleens were removed after each period was complete and single cell suspensions prepared. The isolated cells were stained with antibodies against the markers CD4 (TH), CD8 (TC), CD3 (T), CD45RB220 (B-cell), CD11b (Mac), NK1.1 (NK) and CD4/CD25 (TReg) and then analyzed in a flow cytometer. Data shown are mean ± SEM; n = 9–17/regimen. *p < 0.05 versus controls (Student’s t-test).
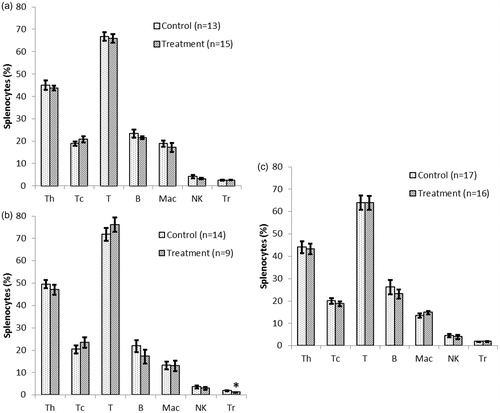
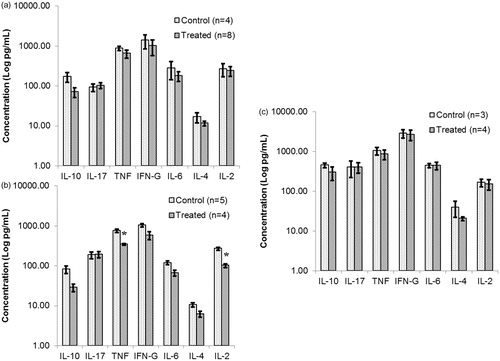
Figure 9. Quantification of cytokine levels released by cultured splenocytes obtained from NOD females that underwent chronic treatment with DDE. Mice were treated for (a) 2, (b) 10 or (c) 16 weeks with 50 mg DDE/kg or vehicle. Spleens were removed after each period was complete and single cell suspensions prepared. After 48 h of culture in the presence of ConA (3 μg/ml), supernatants were analyzed using a CBA mouse TH1/TH2/TH17 kit that permits quantification of IL-6, TNFα, IFNγ, IL-2, IL-4, IL-10 and IL-17. Data shown are mean ± SEM; n = 3–8/regimen. *p < 0.05 versus corresponding control (Student’s t-test).