Figures & data
Figure 1. Schematic diagram of ACR and OVA administrations. On indicated days, mice were exposed to 5 ppm ACR for 4 h (squares) and/or 1% OVA in PBS for 30 min (circles). All animals treated with ACR only, OVA only or OVA and ACR were challenged with OVA on Days 19–21. Sample collection occurred on Day 23. Naive mice received no treatment.
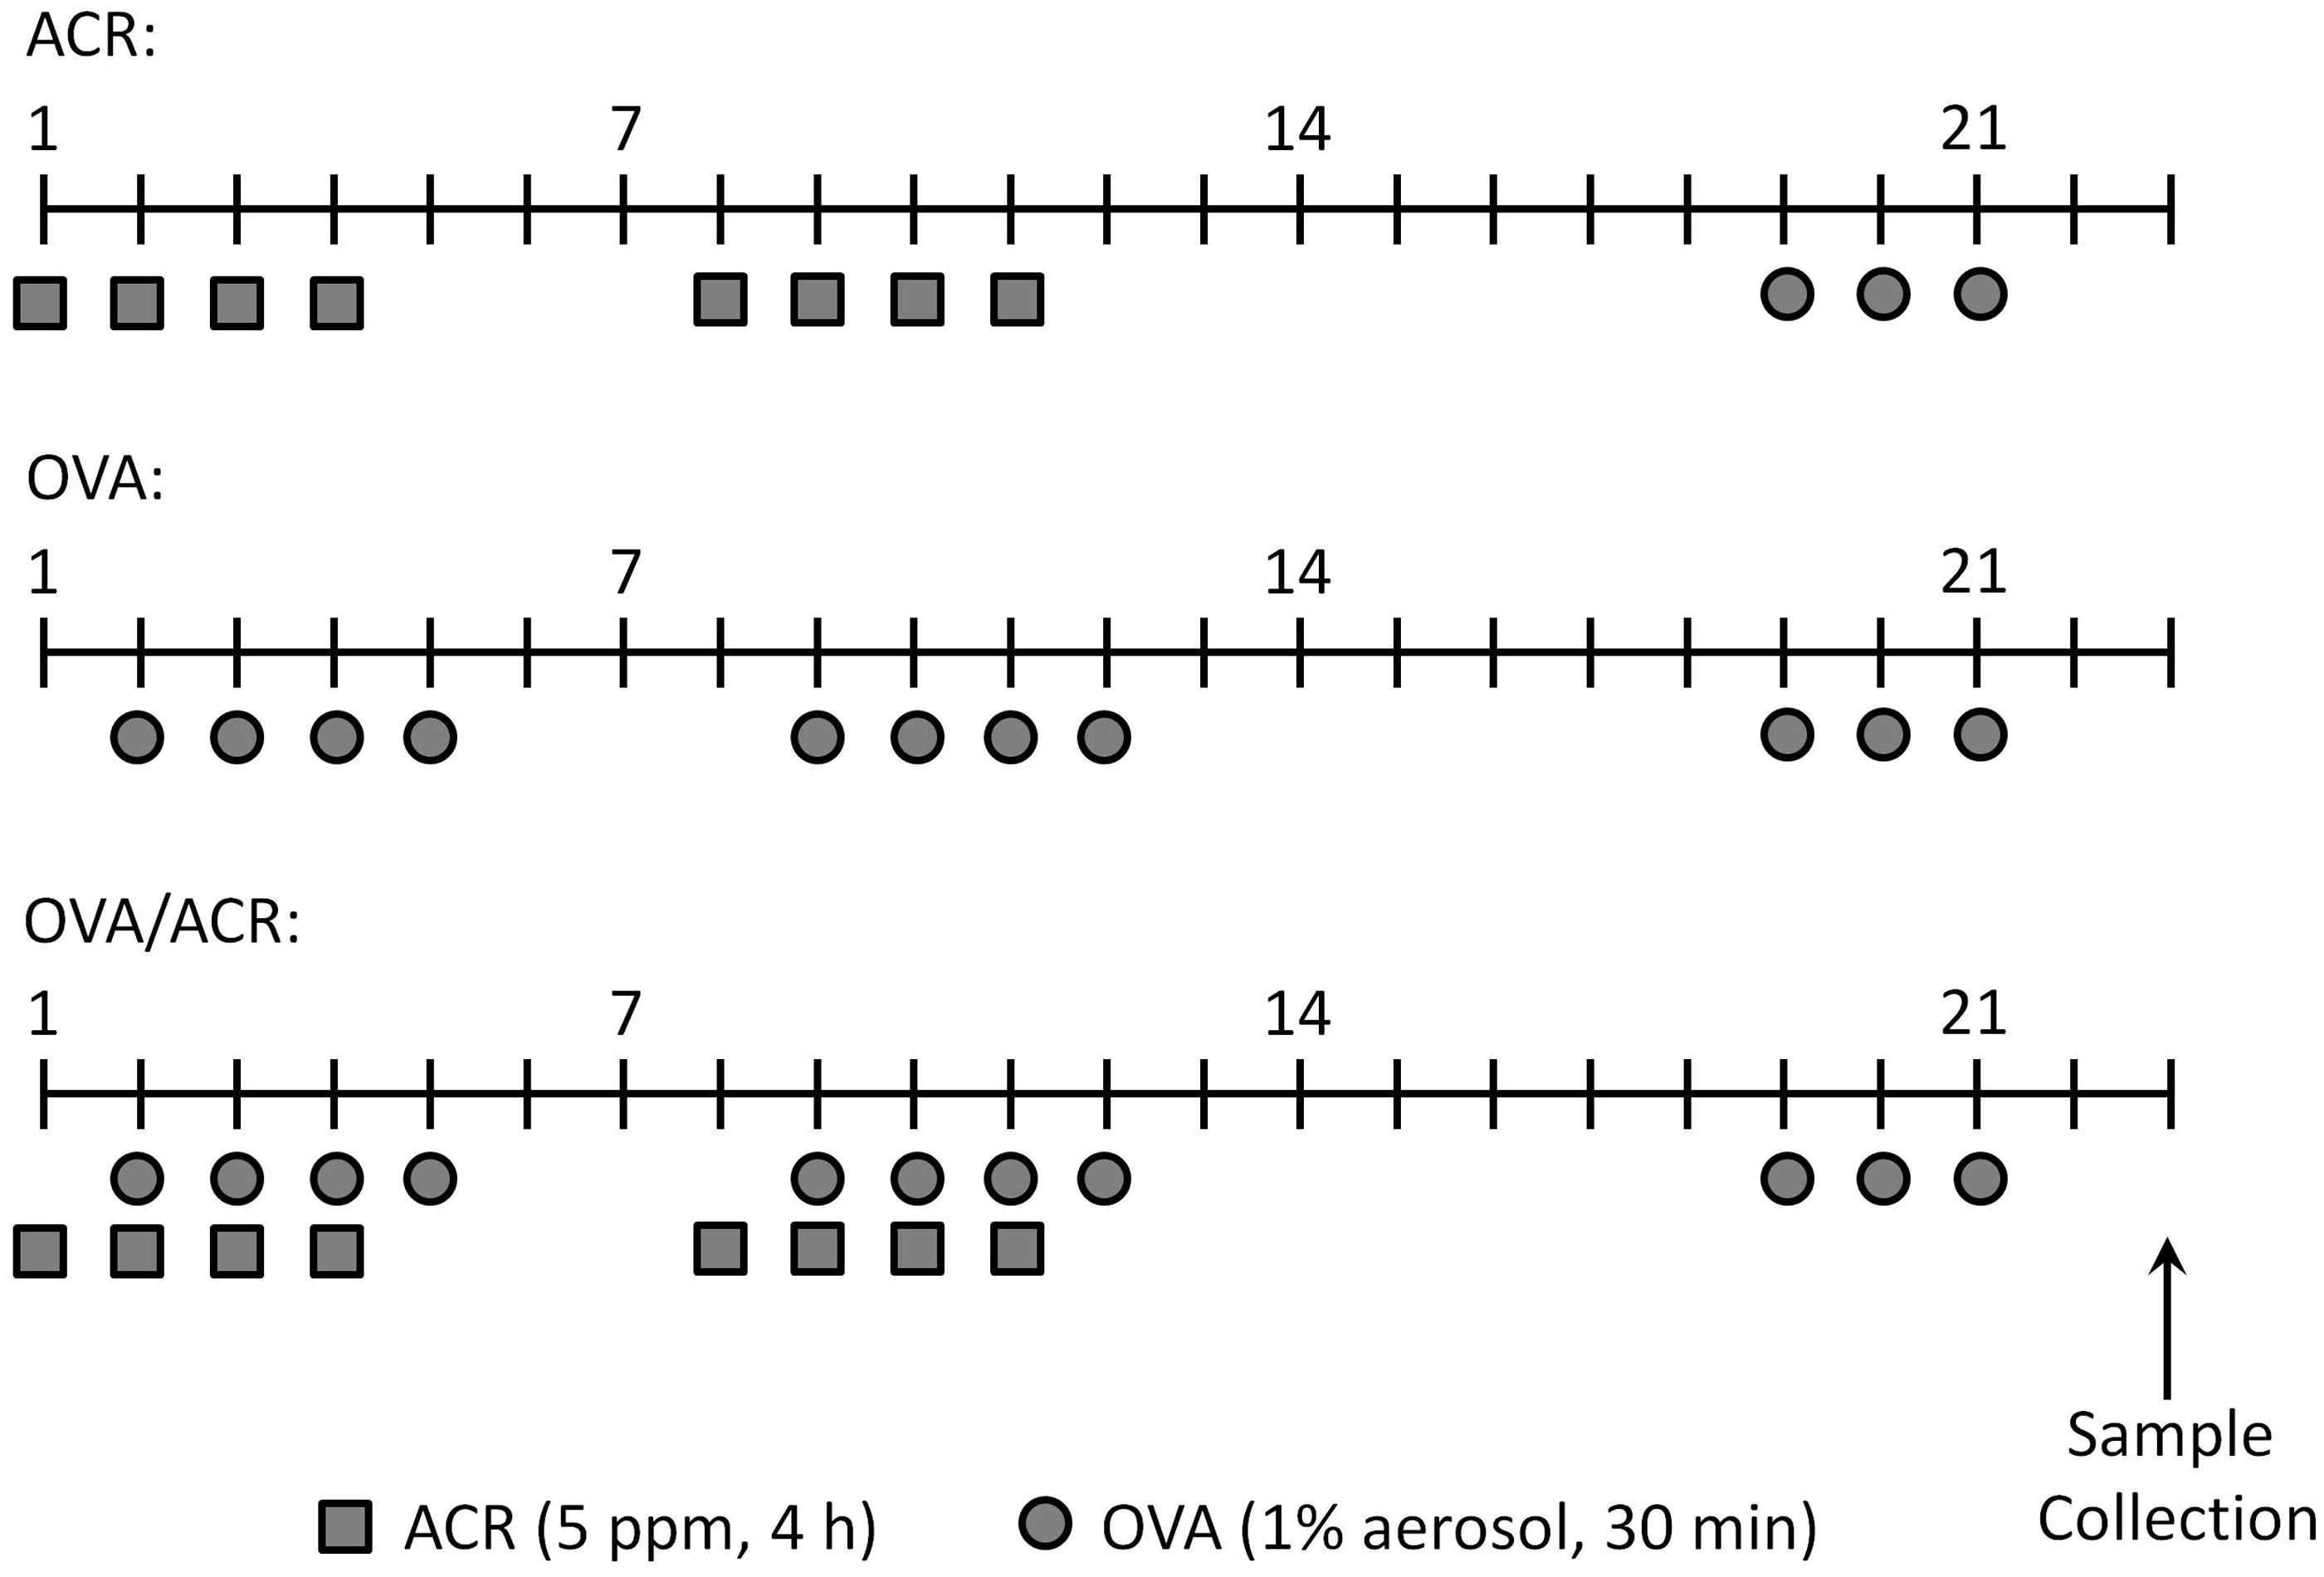
Table 1. Primers used for qPCR of cytokine and chemokines in lung tissues.
Figure 2. (a) Anti-OVA IgG1 and (b) anti-OVA IgG2a levels in sera from naive, ACR-, OVA- and OVA/ACR-treated animals collected on Day 23. Bars represent mean ± SEM. *p < 0.05 and **p < 0.005 compared between indicated treatment groups. OD, Optical Density. Naive: n = 4; ACR, OVA and OVA/ACR: n = 10–14.
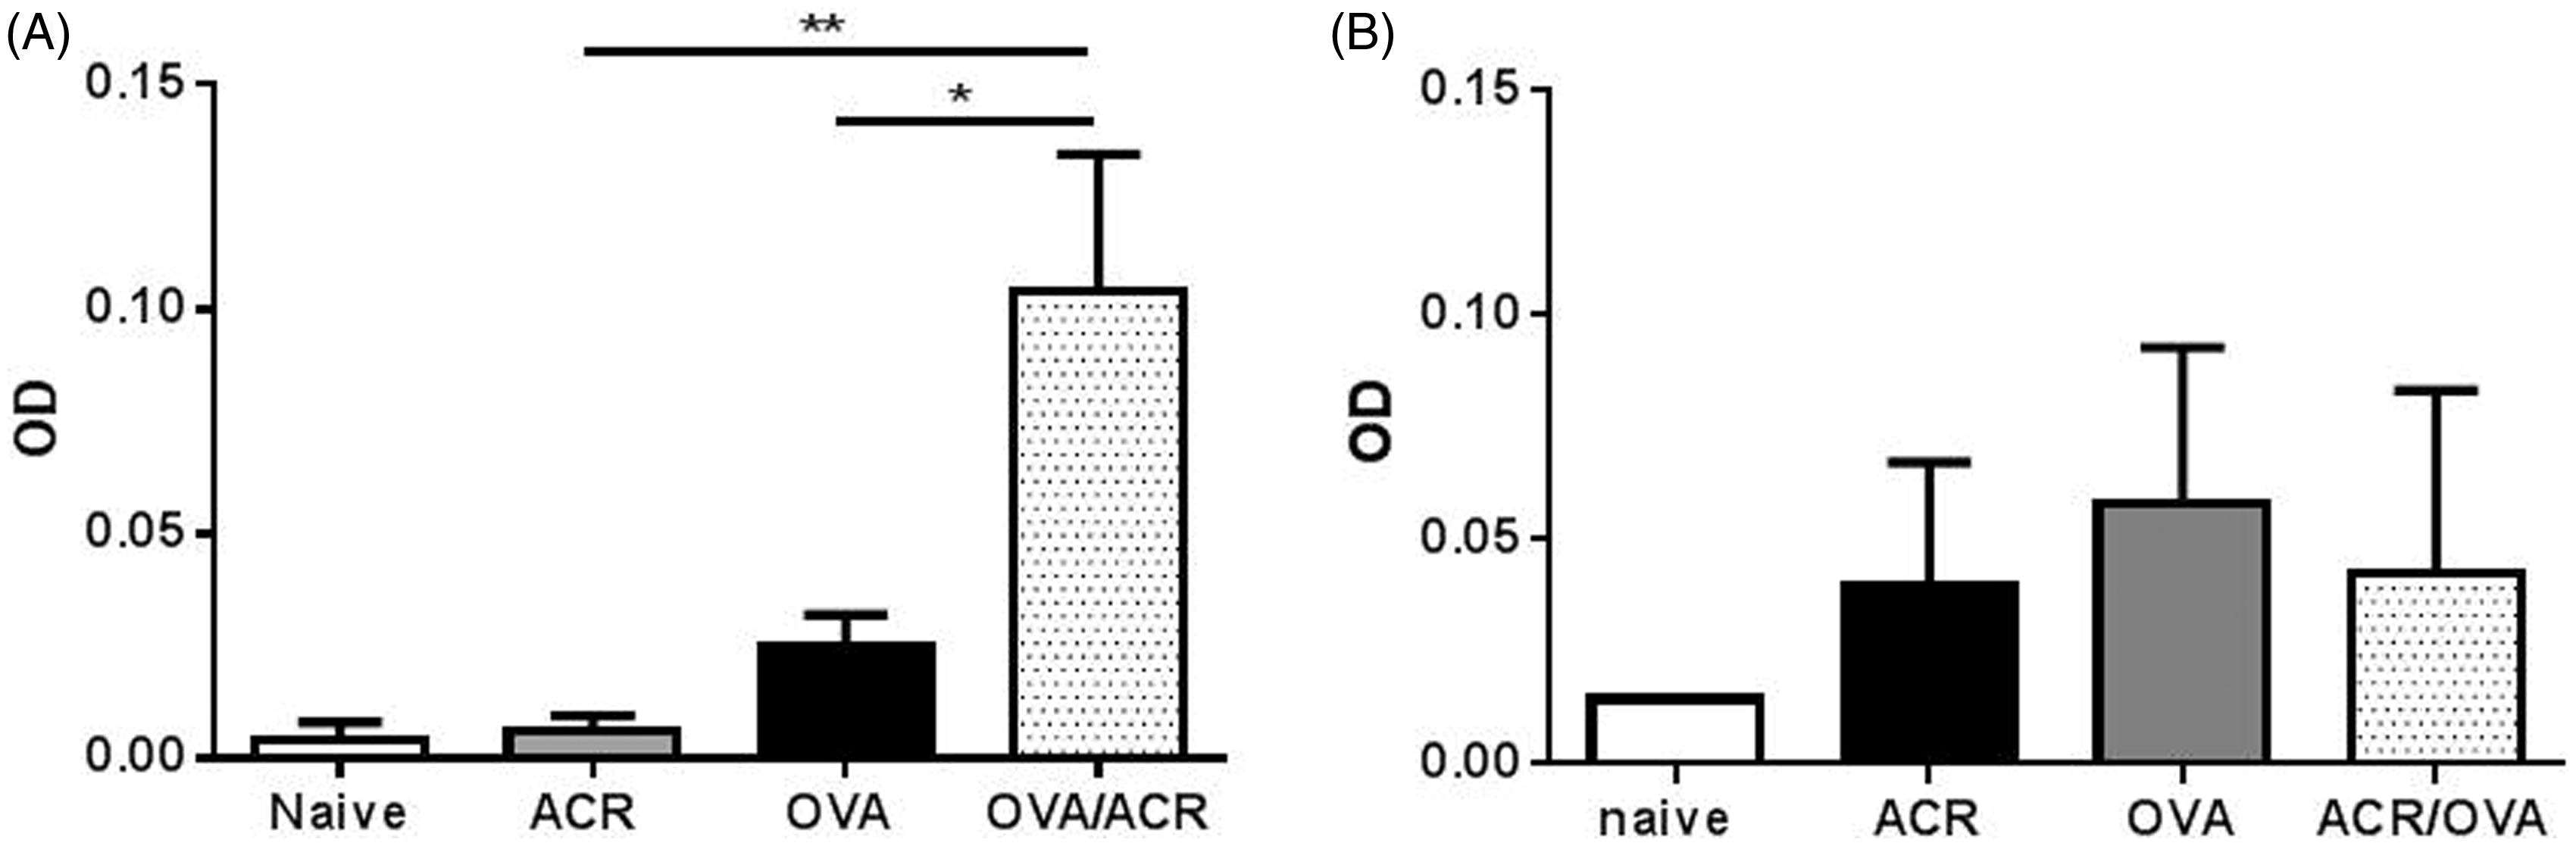
Figure 3. Airway influx of (a) total leukocytes and (b) macrophages, neutrophils, lymphocytes and eosinophils in BALF of naive, ACR-, OVA- and OVA/ACR-treated animals collected on Day 23. Bars represent mean ± SEM. *p < 0.05 and **p < 0.01 compared between indicated treatment groups. Naive: n = 4; ACR, OVA and OVA/ACR: n = 14. (c) Representative lung sections from OVA-, ACR- and OVA/ACR-treated mice collected after subsequent OVA challenge (stained with H&E). Bar = 50 μm.
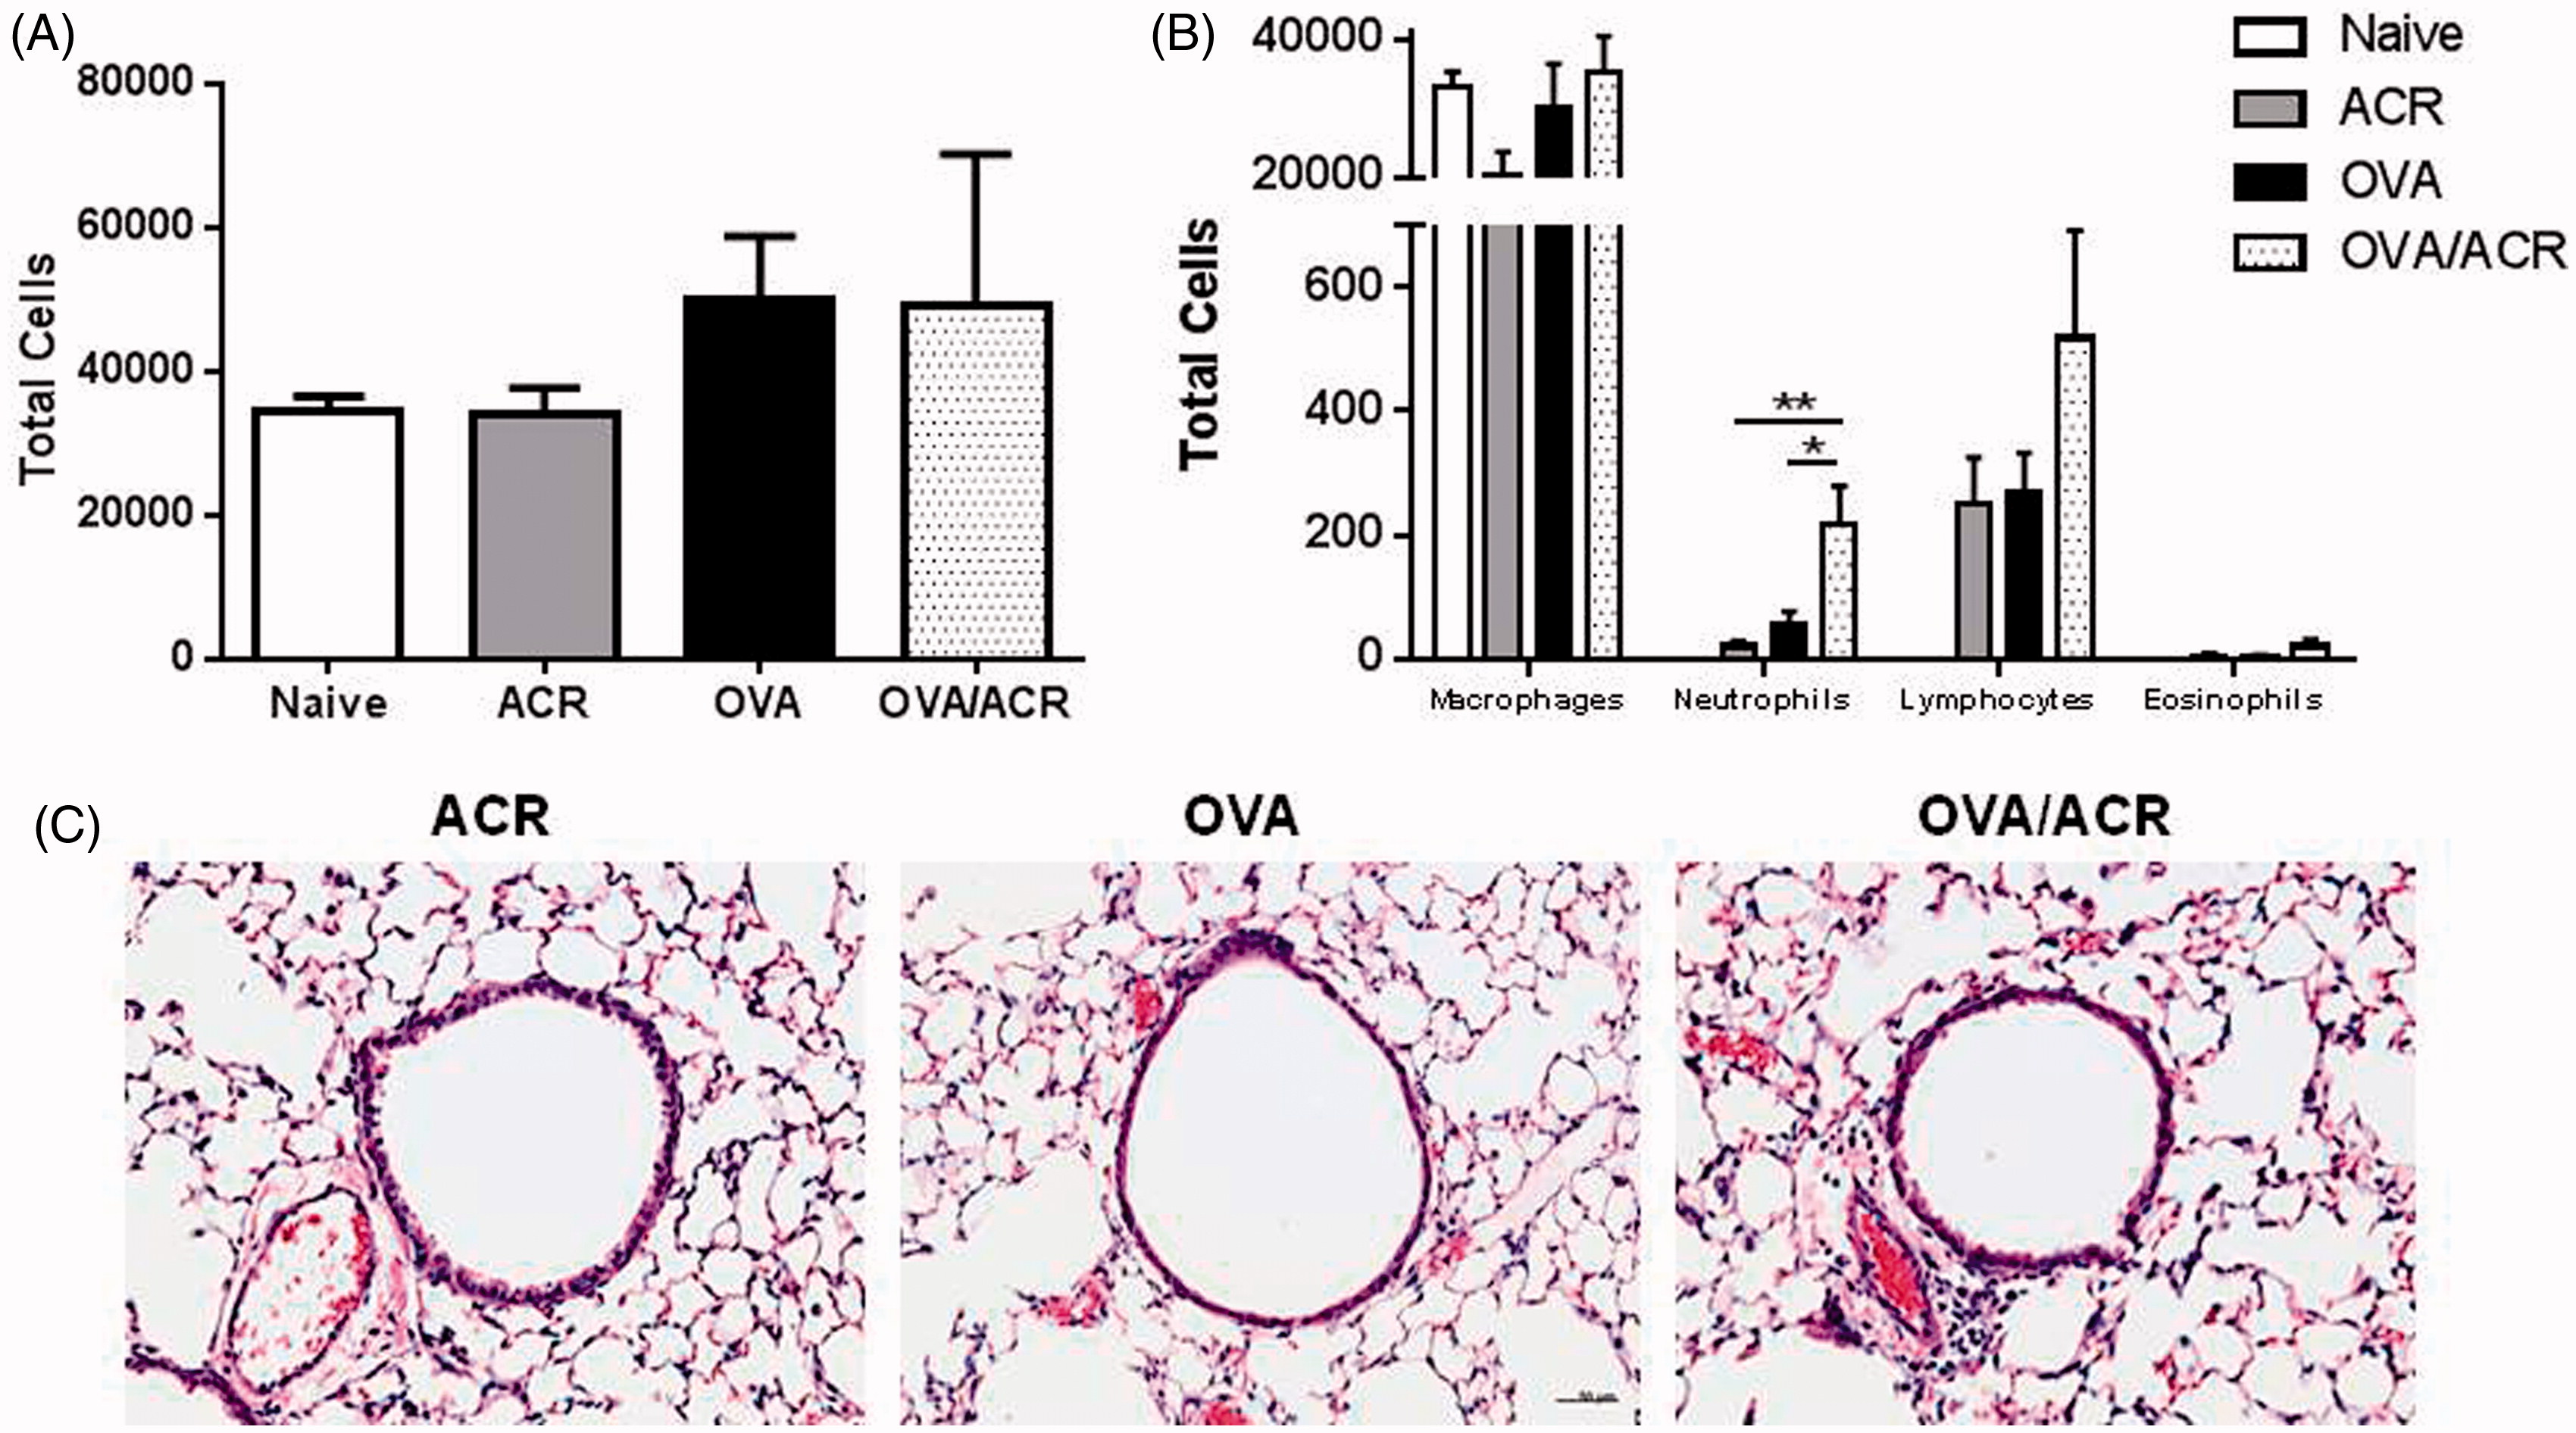
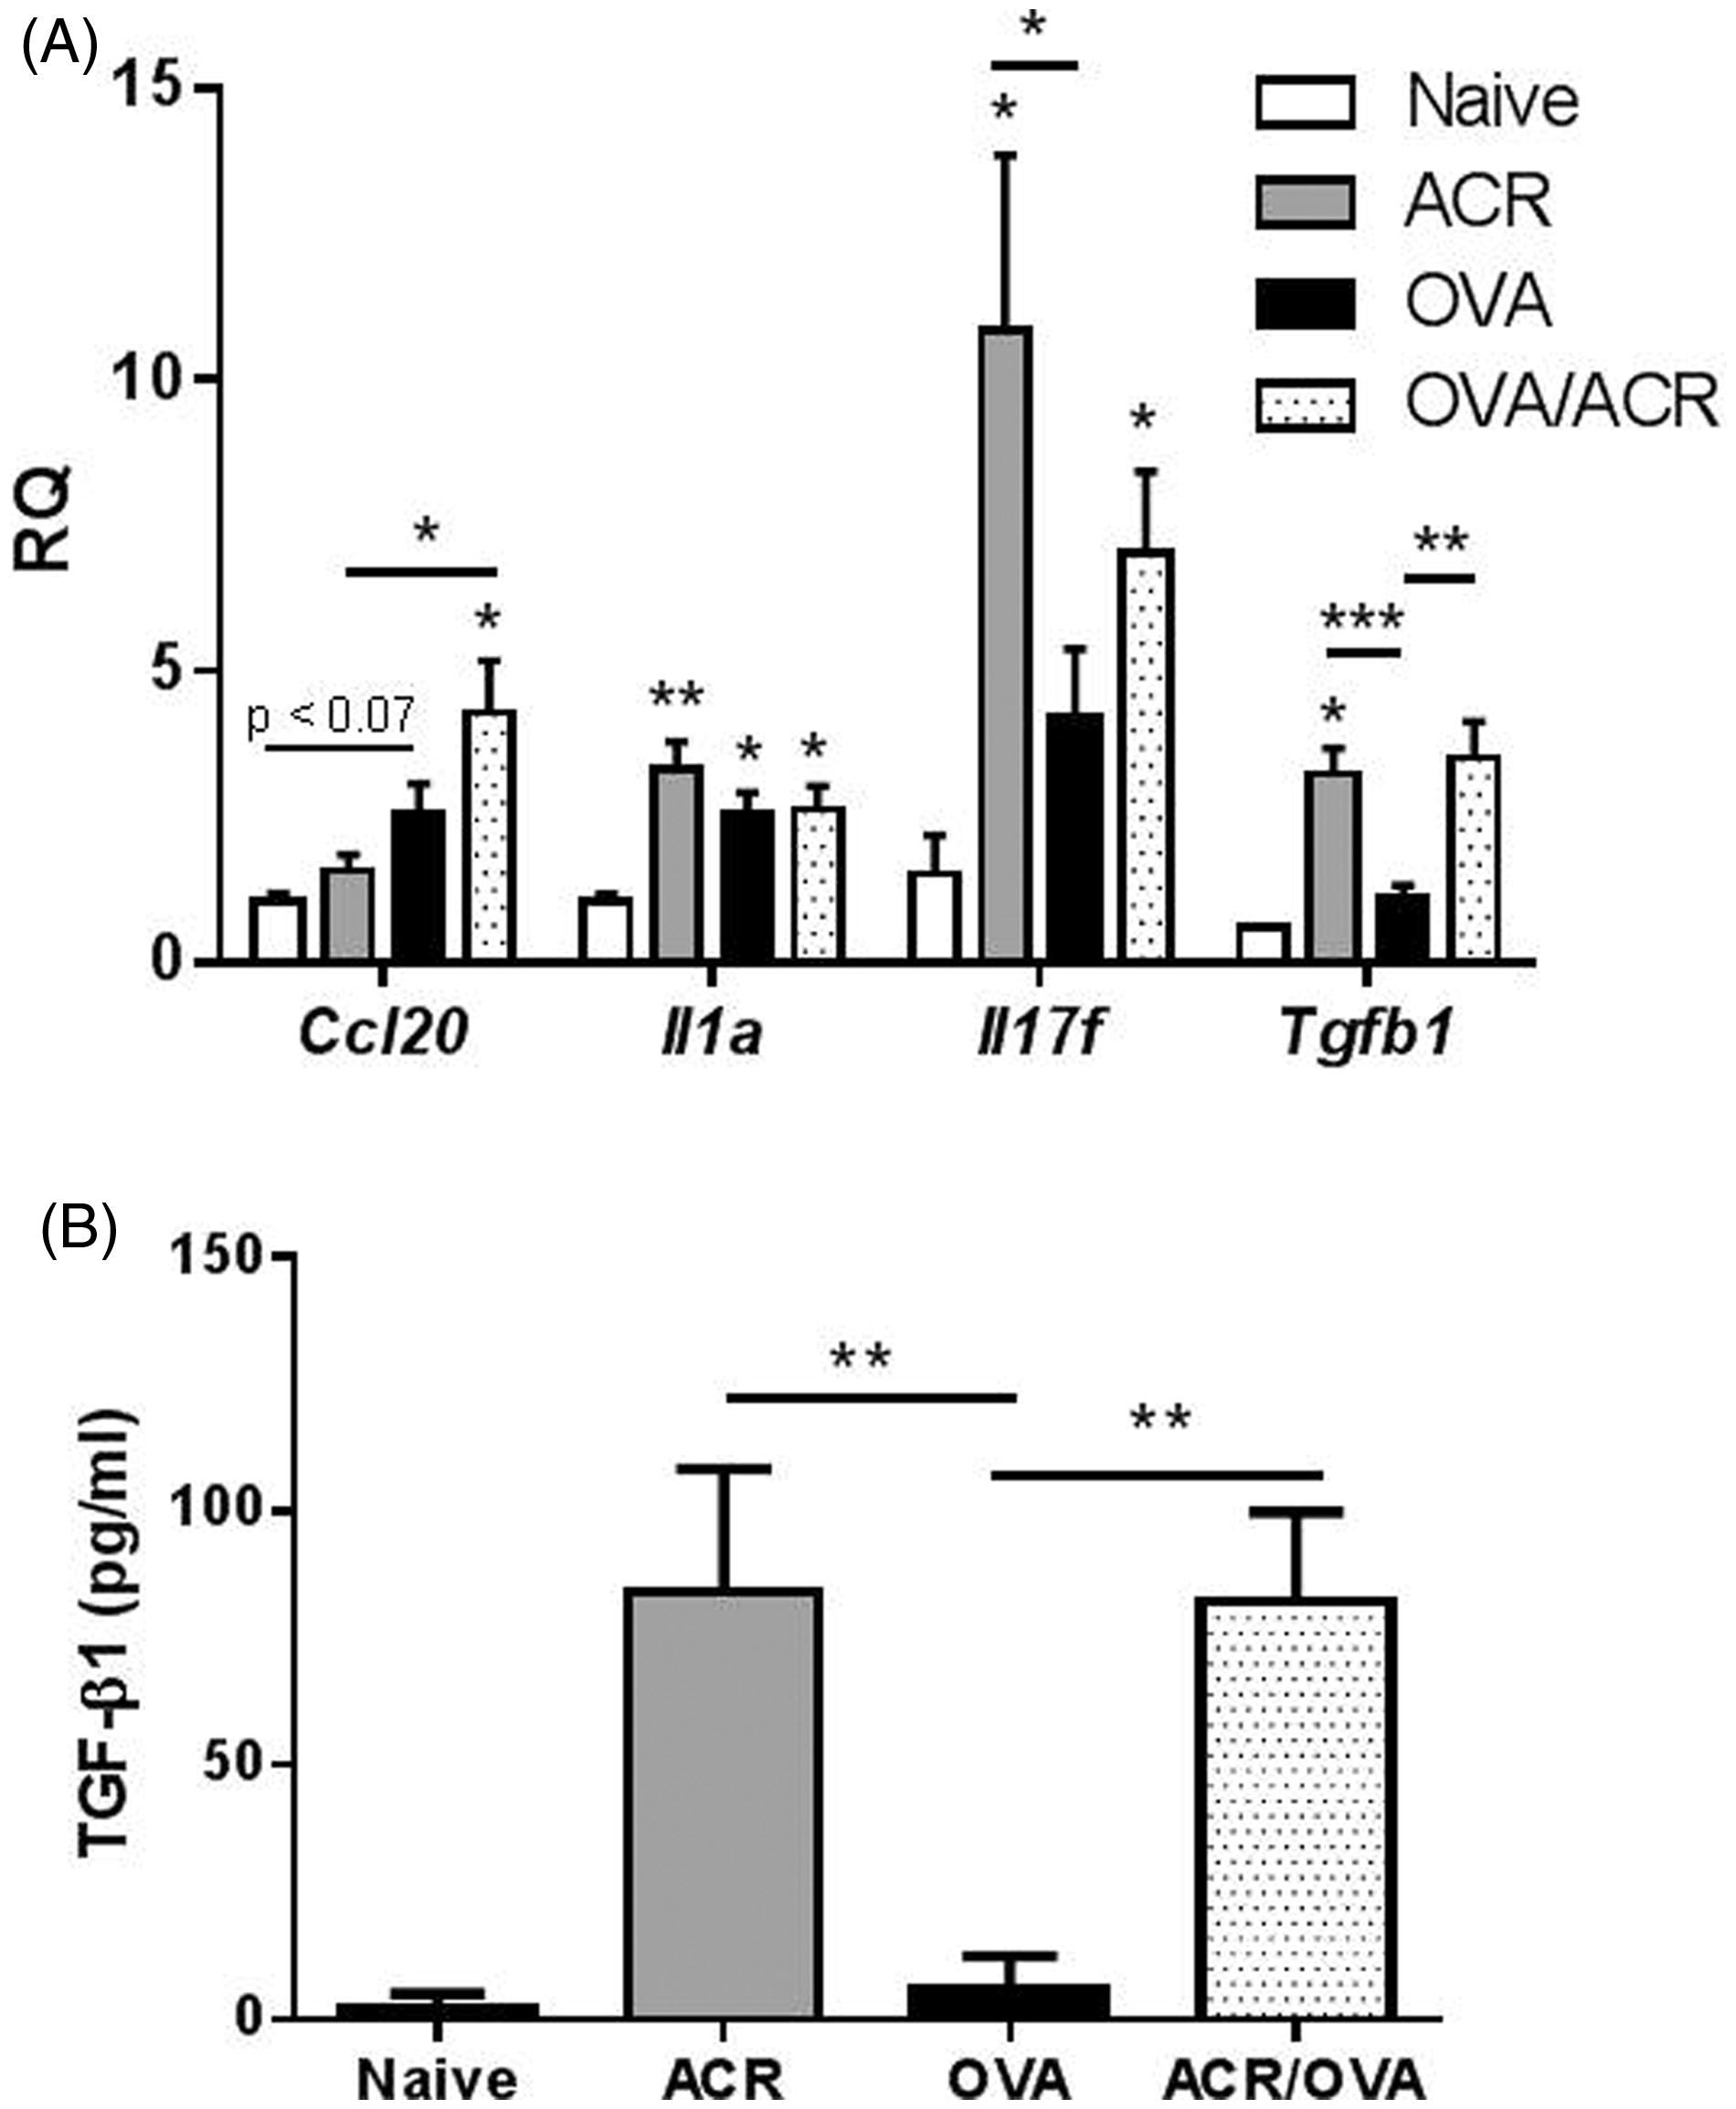
Figure 4. (a) mRNA expression of ccl20, il1a, il17f and tfgb1 in lung tissue and (b) TGFβ1 levels in BALF of naive, ACR-, OVA- and OVA/ACR-treated animals collected on Day 23. Bars represent mean ± SEM. *p < 0.05, **p < 0.01 and ***p < 0.001 compared to control (open bar) or between treatment groups indicated by line. RQ, relative quantifications. Naive: n = 2–5; ACR, OVA and OVA/ACR: n = 8–11.