Figures & data
Figure 1. RAW264.7 mouse macrophages treated for 24 h with (a) 25 µg/ml BioPure AuNP without LPS (left) and with LPS (right, 1 µg/ml). Red/Grey arrow = AuNP concentrated in phagosomes; Black arrow = cell division. (b) Cells treated for 24 h with 50 µg/ml Econix AuNP, with and without LPS. Gray arrow = activated macrophage. Total magnification = 400×.
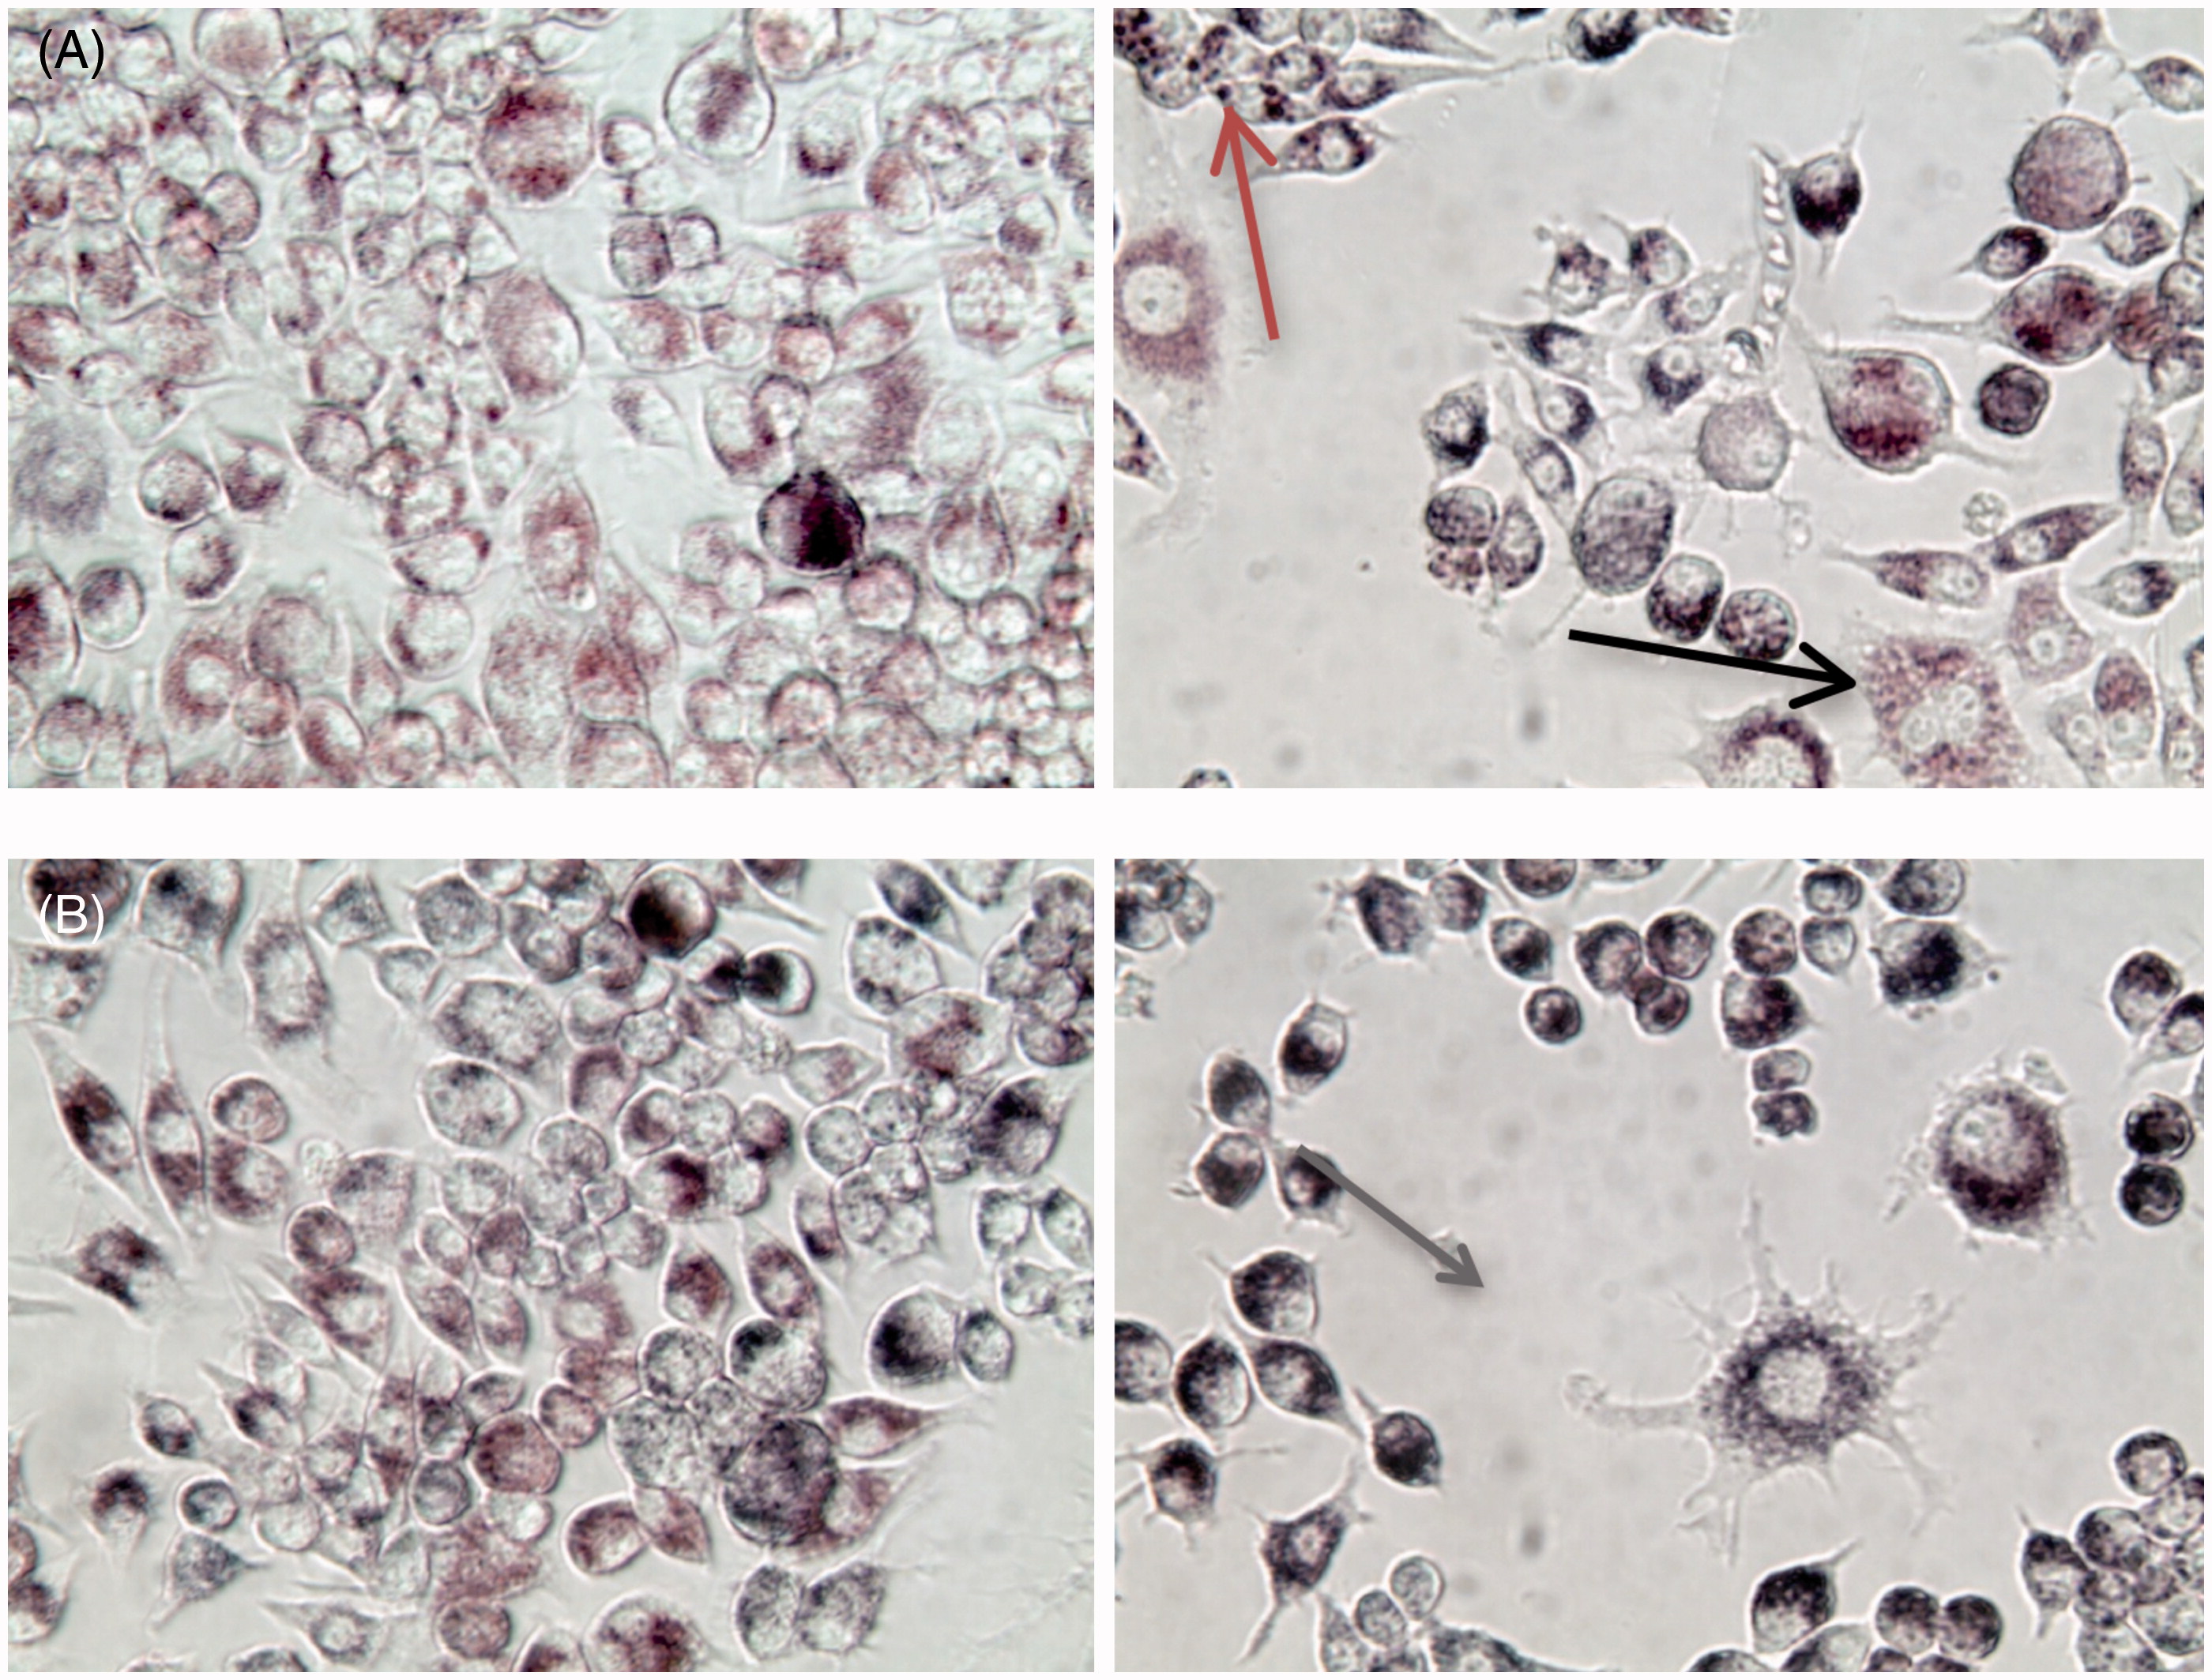
Figure 2. Particle uptake was measured by flow cytometric detection of side scatter. The upper panel shows representative dot plots of untreated RAW macrophages (left) and with 100 ng/ml Econix AuNP (right). Graph shows concentration curves for Econix AuNP with and without LPS, both of which are statistically significant (ANOVA, p < 0.05). *p < 0.05 comparing with LPS to without LPS at each concentration (Bonferroni post-hoc analysis).
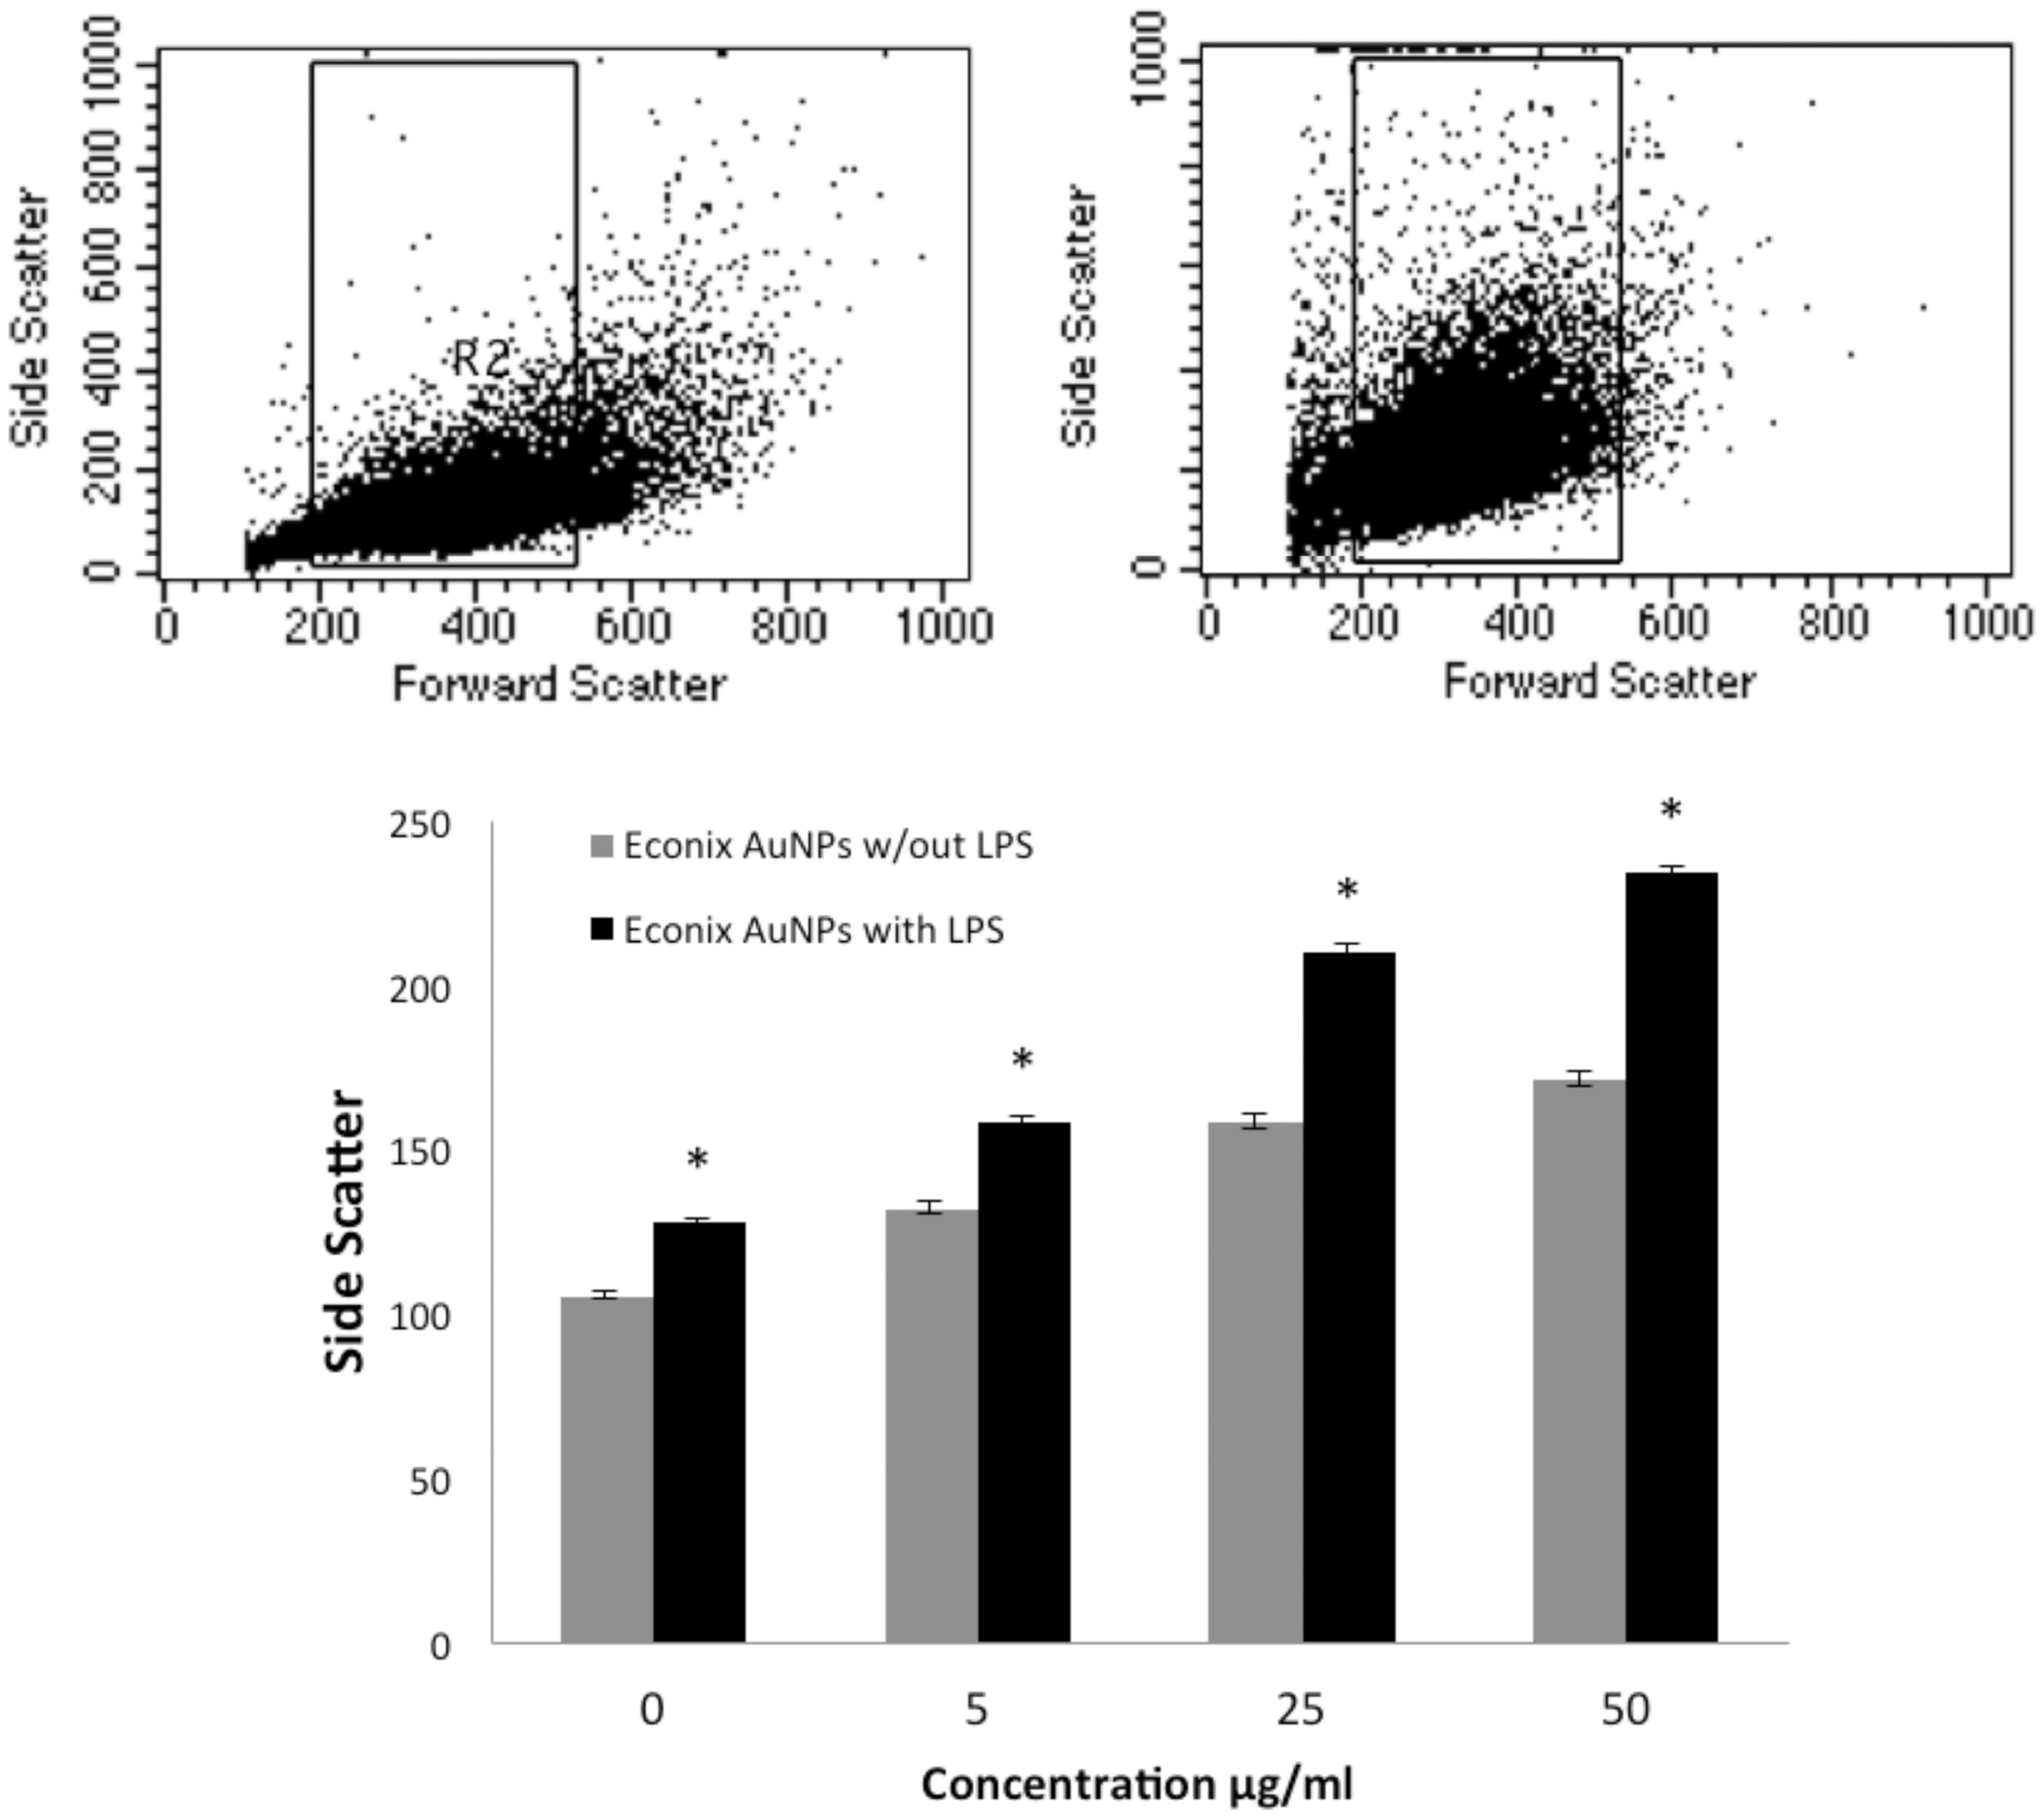
Figure 3. Neither BioPure (Top) nor Econix (bottom) AuNP affected cell viability, as measured by counting (Coulter) all cells in the well after 48 h treatment with particles at concentrations shown. LPS also had no effect on viability at 1 µg/ml.
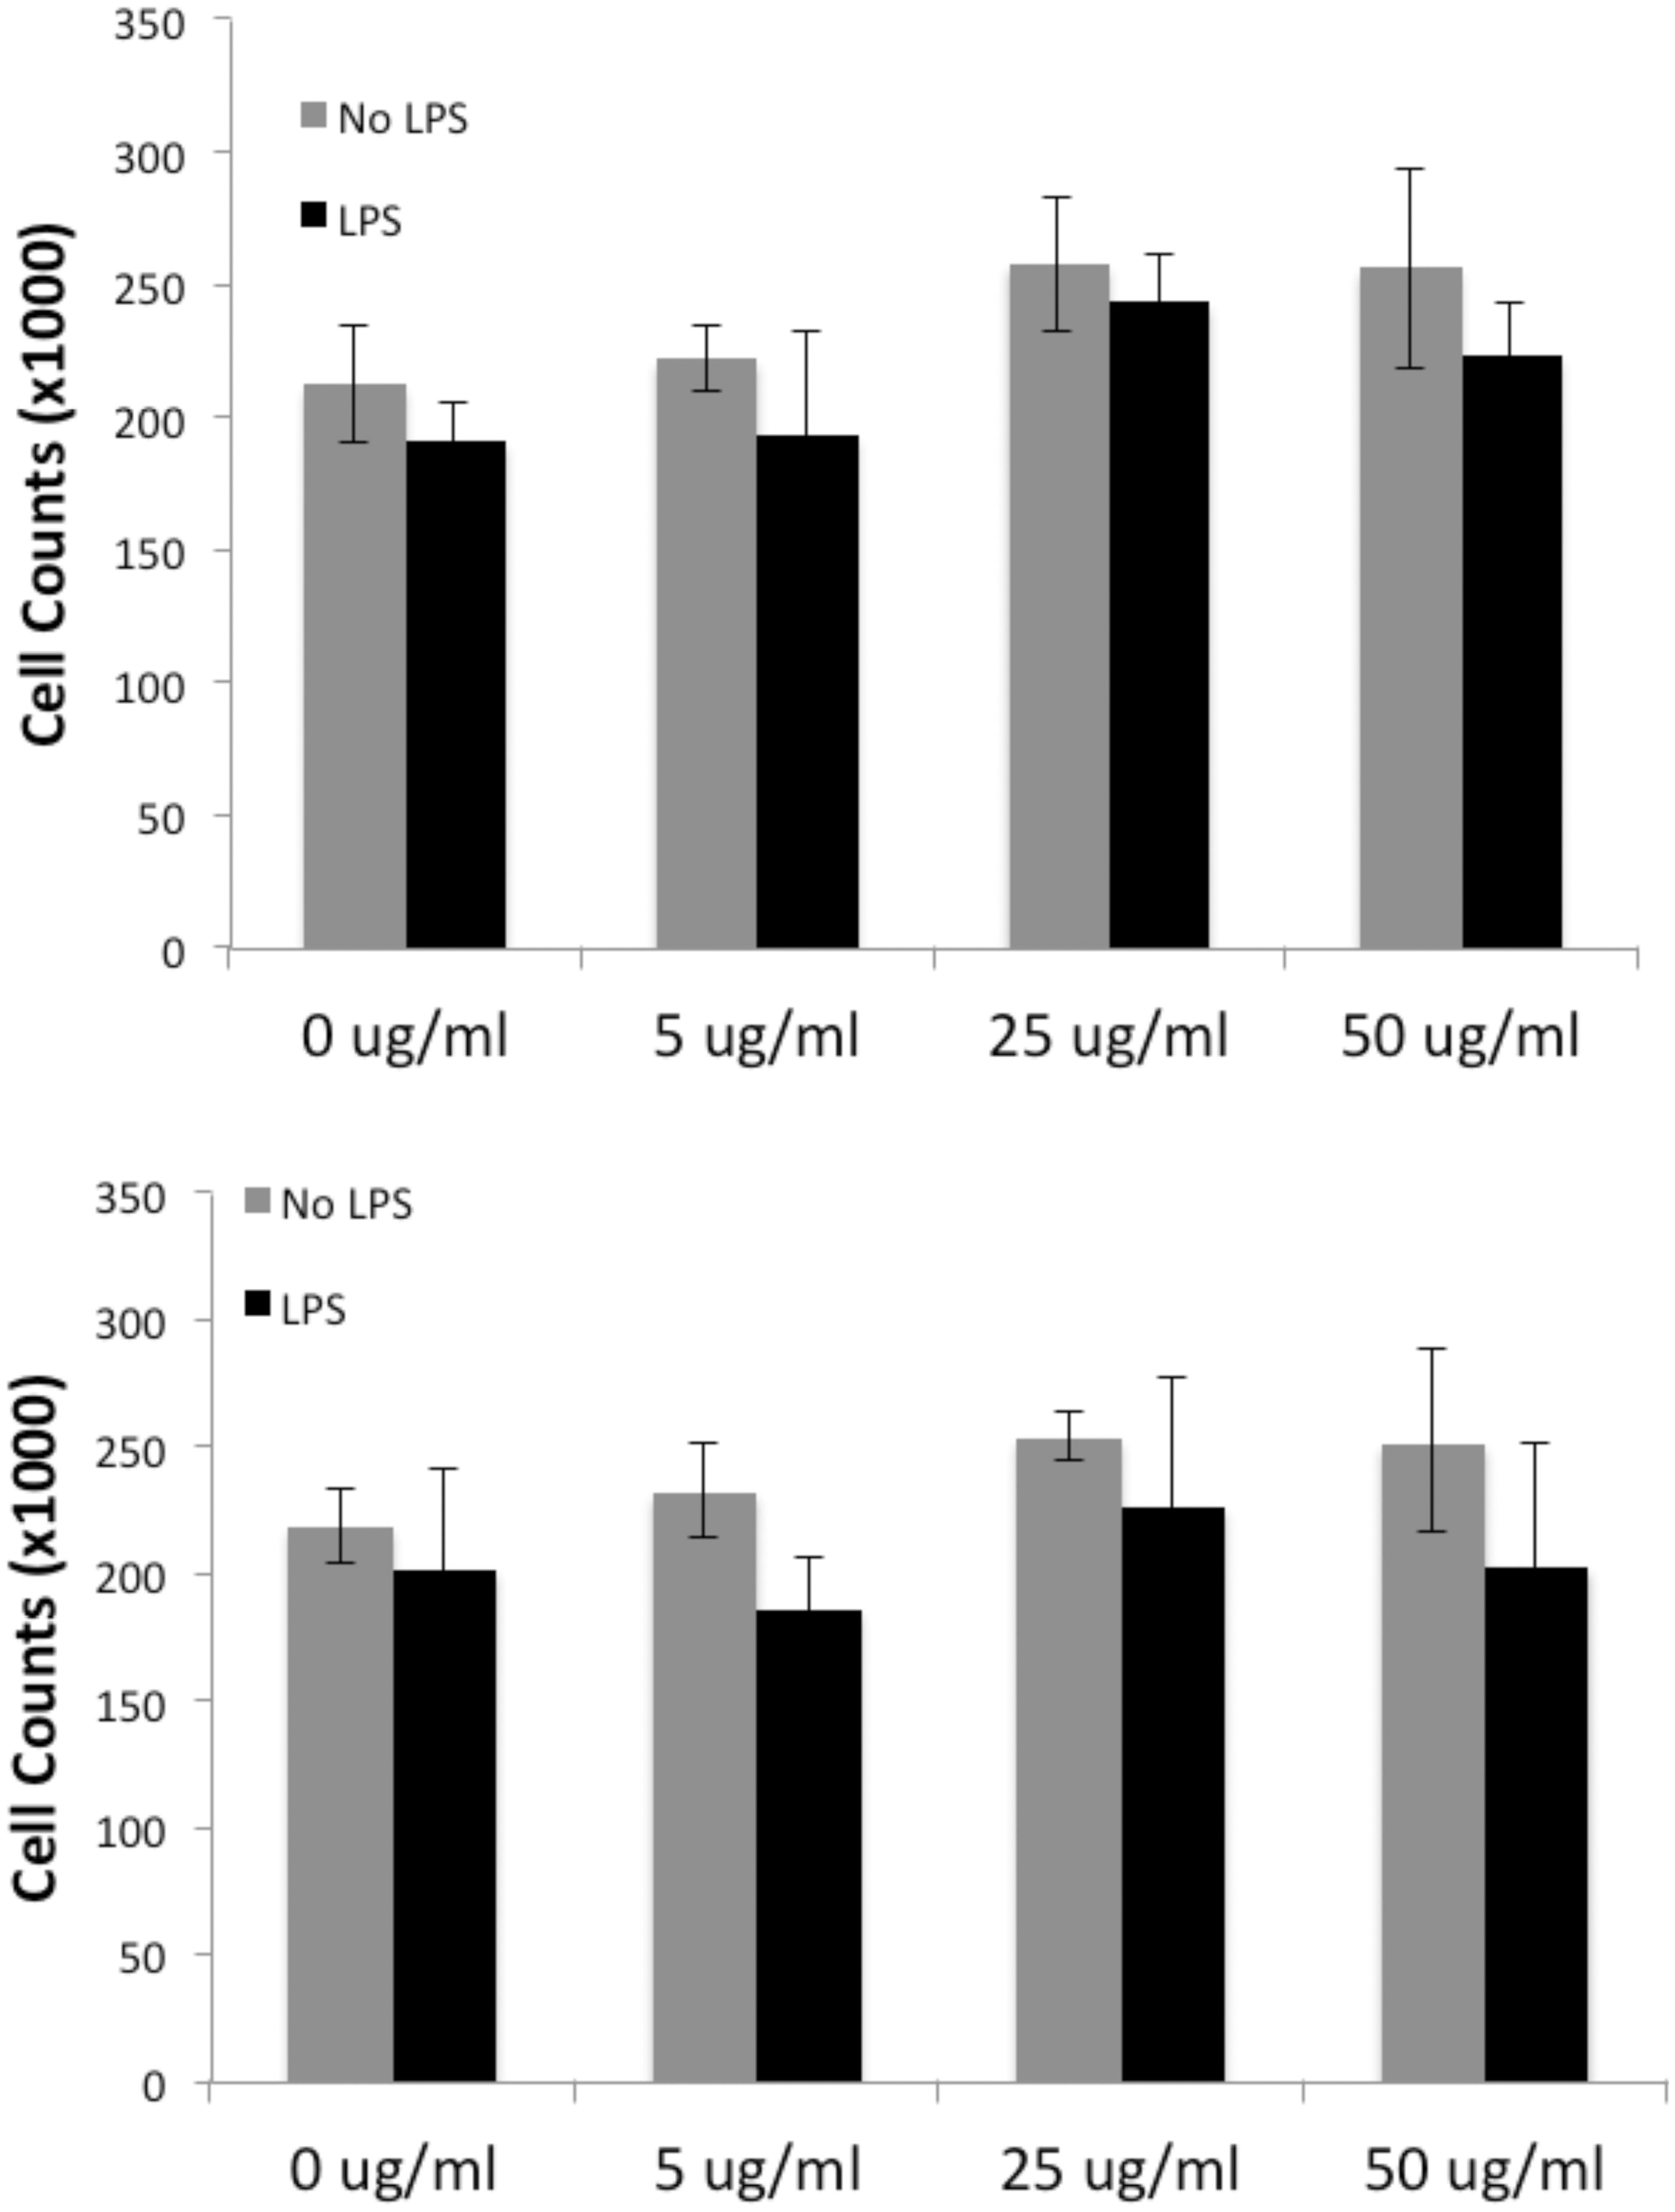
Figure 4. Increasing AuNP concentrations (both BioPure and Econix) reduced ROS production by cultured macrophages. RAW macrophages were treated with AuNP for 20 h and tested for ROS using the DCFDA assay. Top: Comparison of the response with BioPure compared to Econix. By ANOVA, the dose response was statistically significant for both BioPure and Econix AuNP. Middle: BioPure AuNP with and without LPS. By ANOVA, the dose response was statistically significant both with and without LPS. Bottom: Econix AuNP with and without LPS. By ANOVA, the dose response was statistically significant both with and without LPS. n = 4 in all experiments, *p < 0.05 comparing paired (black vs grey) bars.
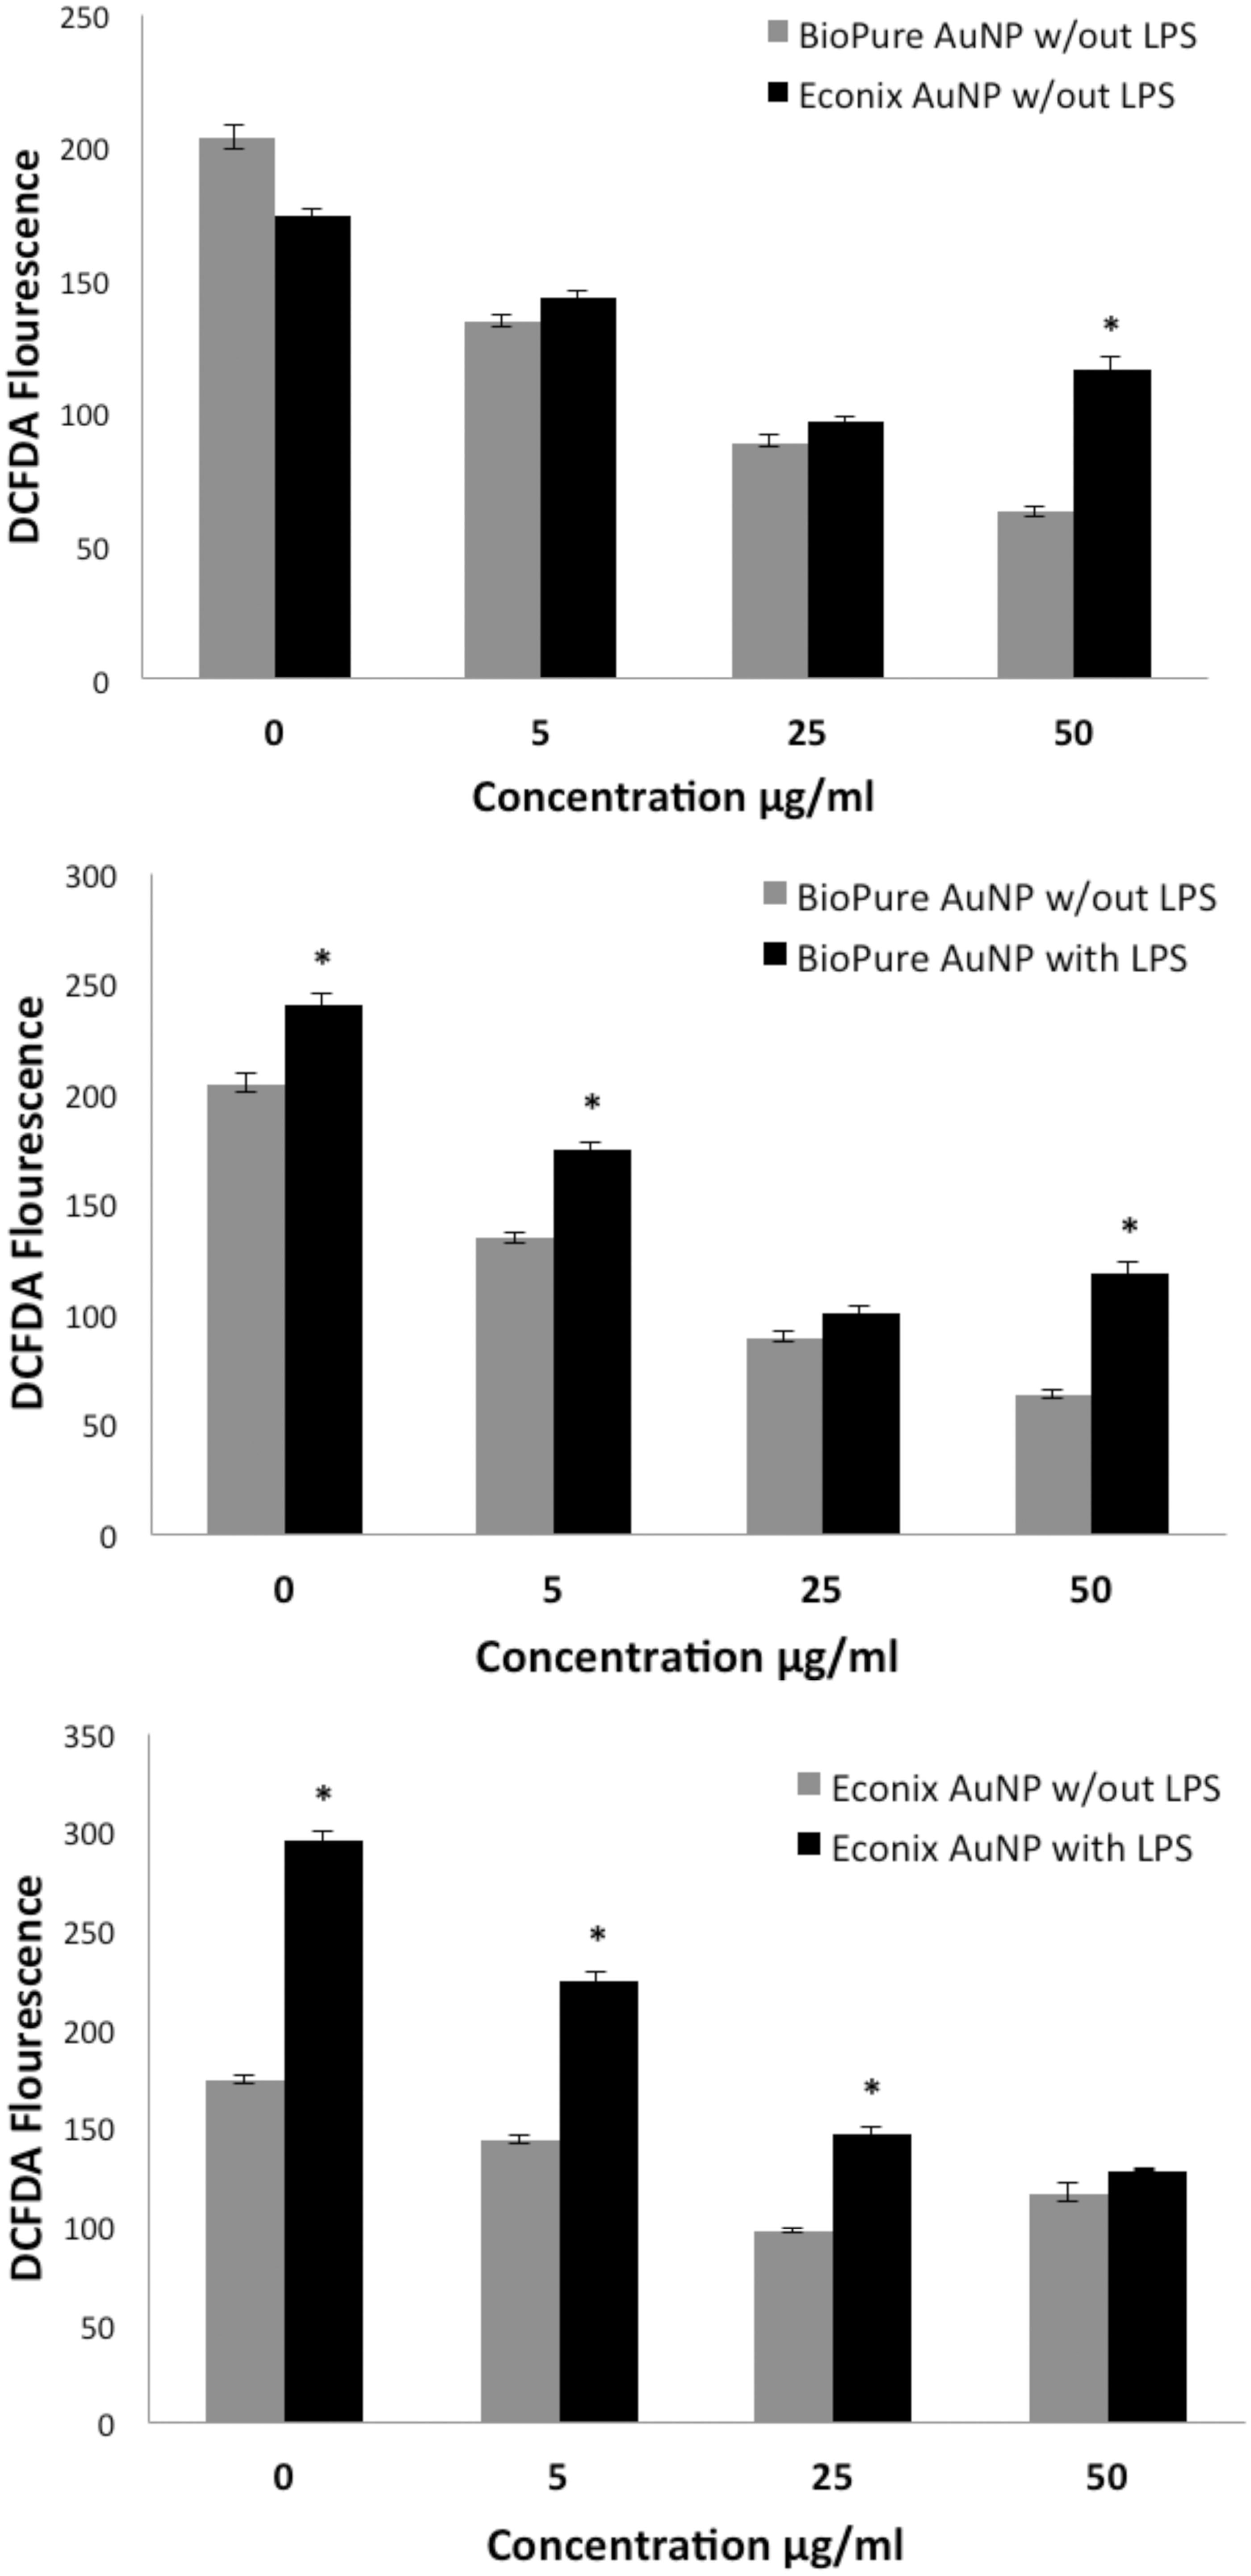
Figure 5. AuNP quenched production of ROS. ROS was measured in RAW macrophage cells treated with BioPure AuNP at different timepoints and concentrations of 0, 5, 25 and 50 µg/ml. Untreated values increased over time and were statistically different from all treatment groups after 18 h. n = 4 in each group. *p < 0.001 [ANOVA].
![Figure 5. AuNP quenched production of ROS. ROS was measured in RAW macrophage cells treated with BioPure AuNP at different timepoints and concentrations of 0, 5, 25 and 50 µg/ml. Untreated values increased over time and were statistically different from all treatment groups after 18 h. n = 4 in each group. *p < 0.001 [ANOVA].](/cms/asset/c471875e-6fa3-4963-be61-b9fba7330f92/iimt_a_1035819_f0005_b.jpg)
Figure 6. Both BioPure and Econix AuNP reduced TNF levels compared to control. Culture media from RAW cells treated for 48 h with AuNP and assayed for TNFα. Top: BioPure AuNP reduced TNFα in dose-dependent manner (p < 0.05, ANOVA); (a) significantly different from “no treatment” control in BioPure series. Econix AuNP reduced TNFα at all levels (b = change from control in Econix series), but there was no difference between effects from concentrations of 5, 25 and 50 µg/ml. TNFα level was higher for Econix than BioPure at 50 µg/ml (*p < 0.05, t-test). n = 4. Bottom: LPS increased TNFα at all concentrations of AuNP including control, *p < 0.01 compared to no LPS at that concentration. BioPure AuNP reduced the LPS-induced TNFα levels in a dose-dependent manner (B = p < 0.01).
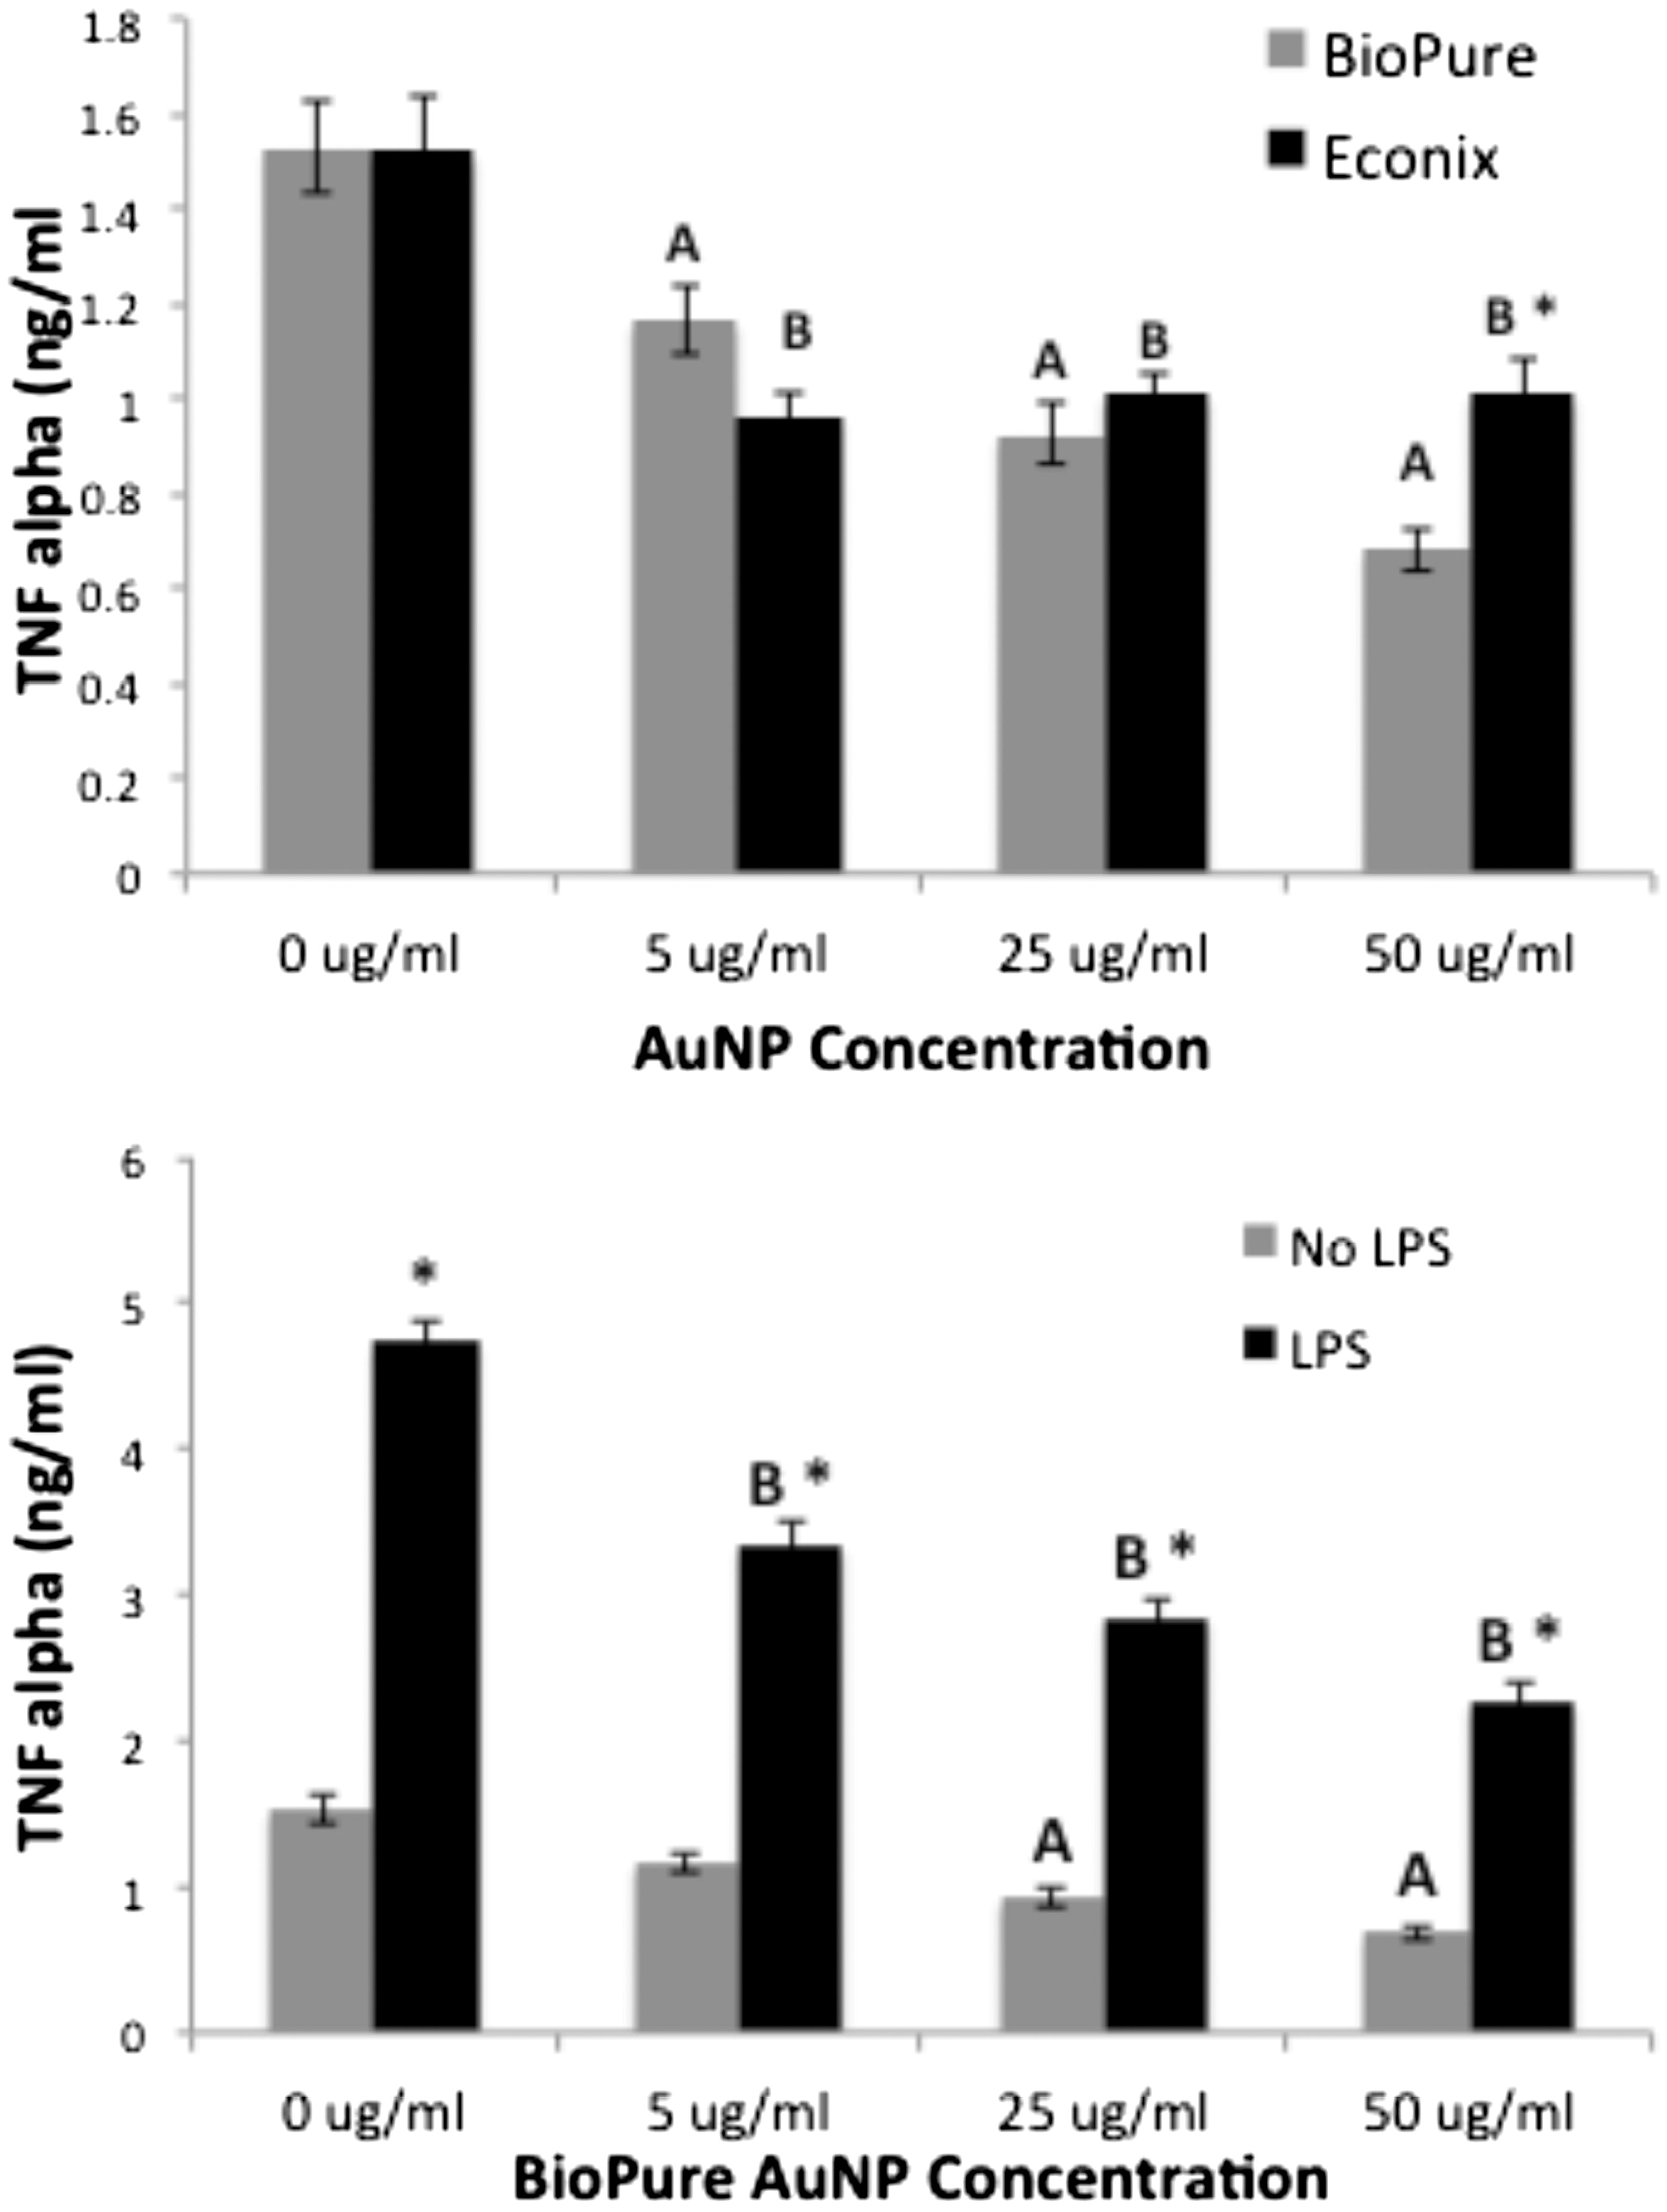
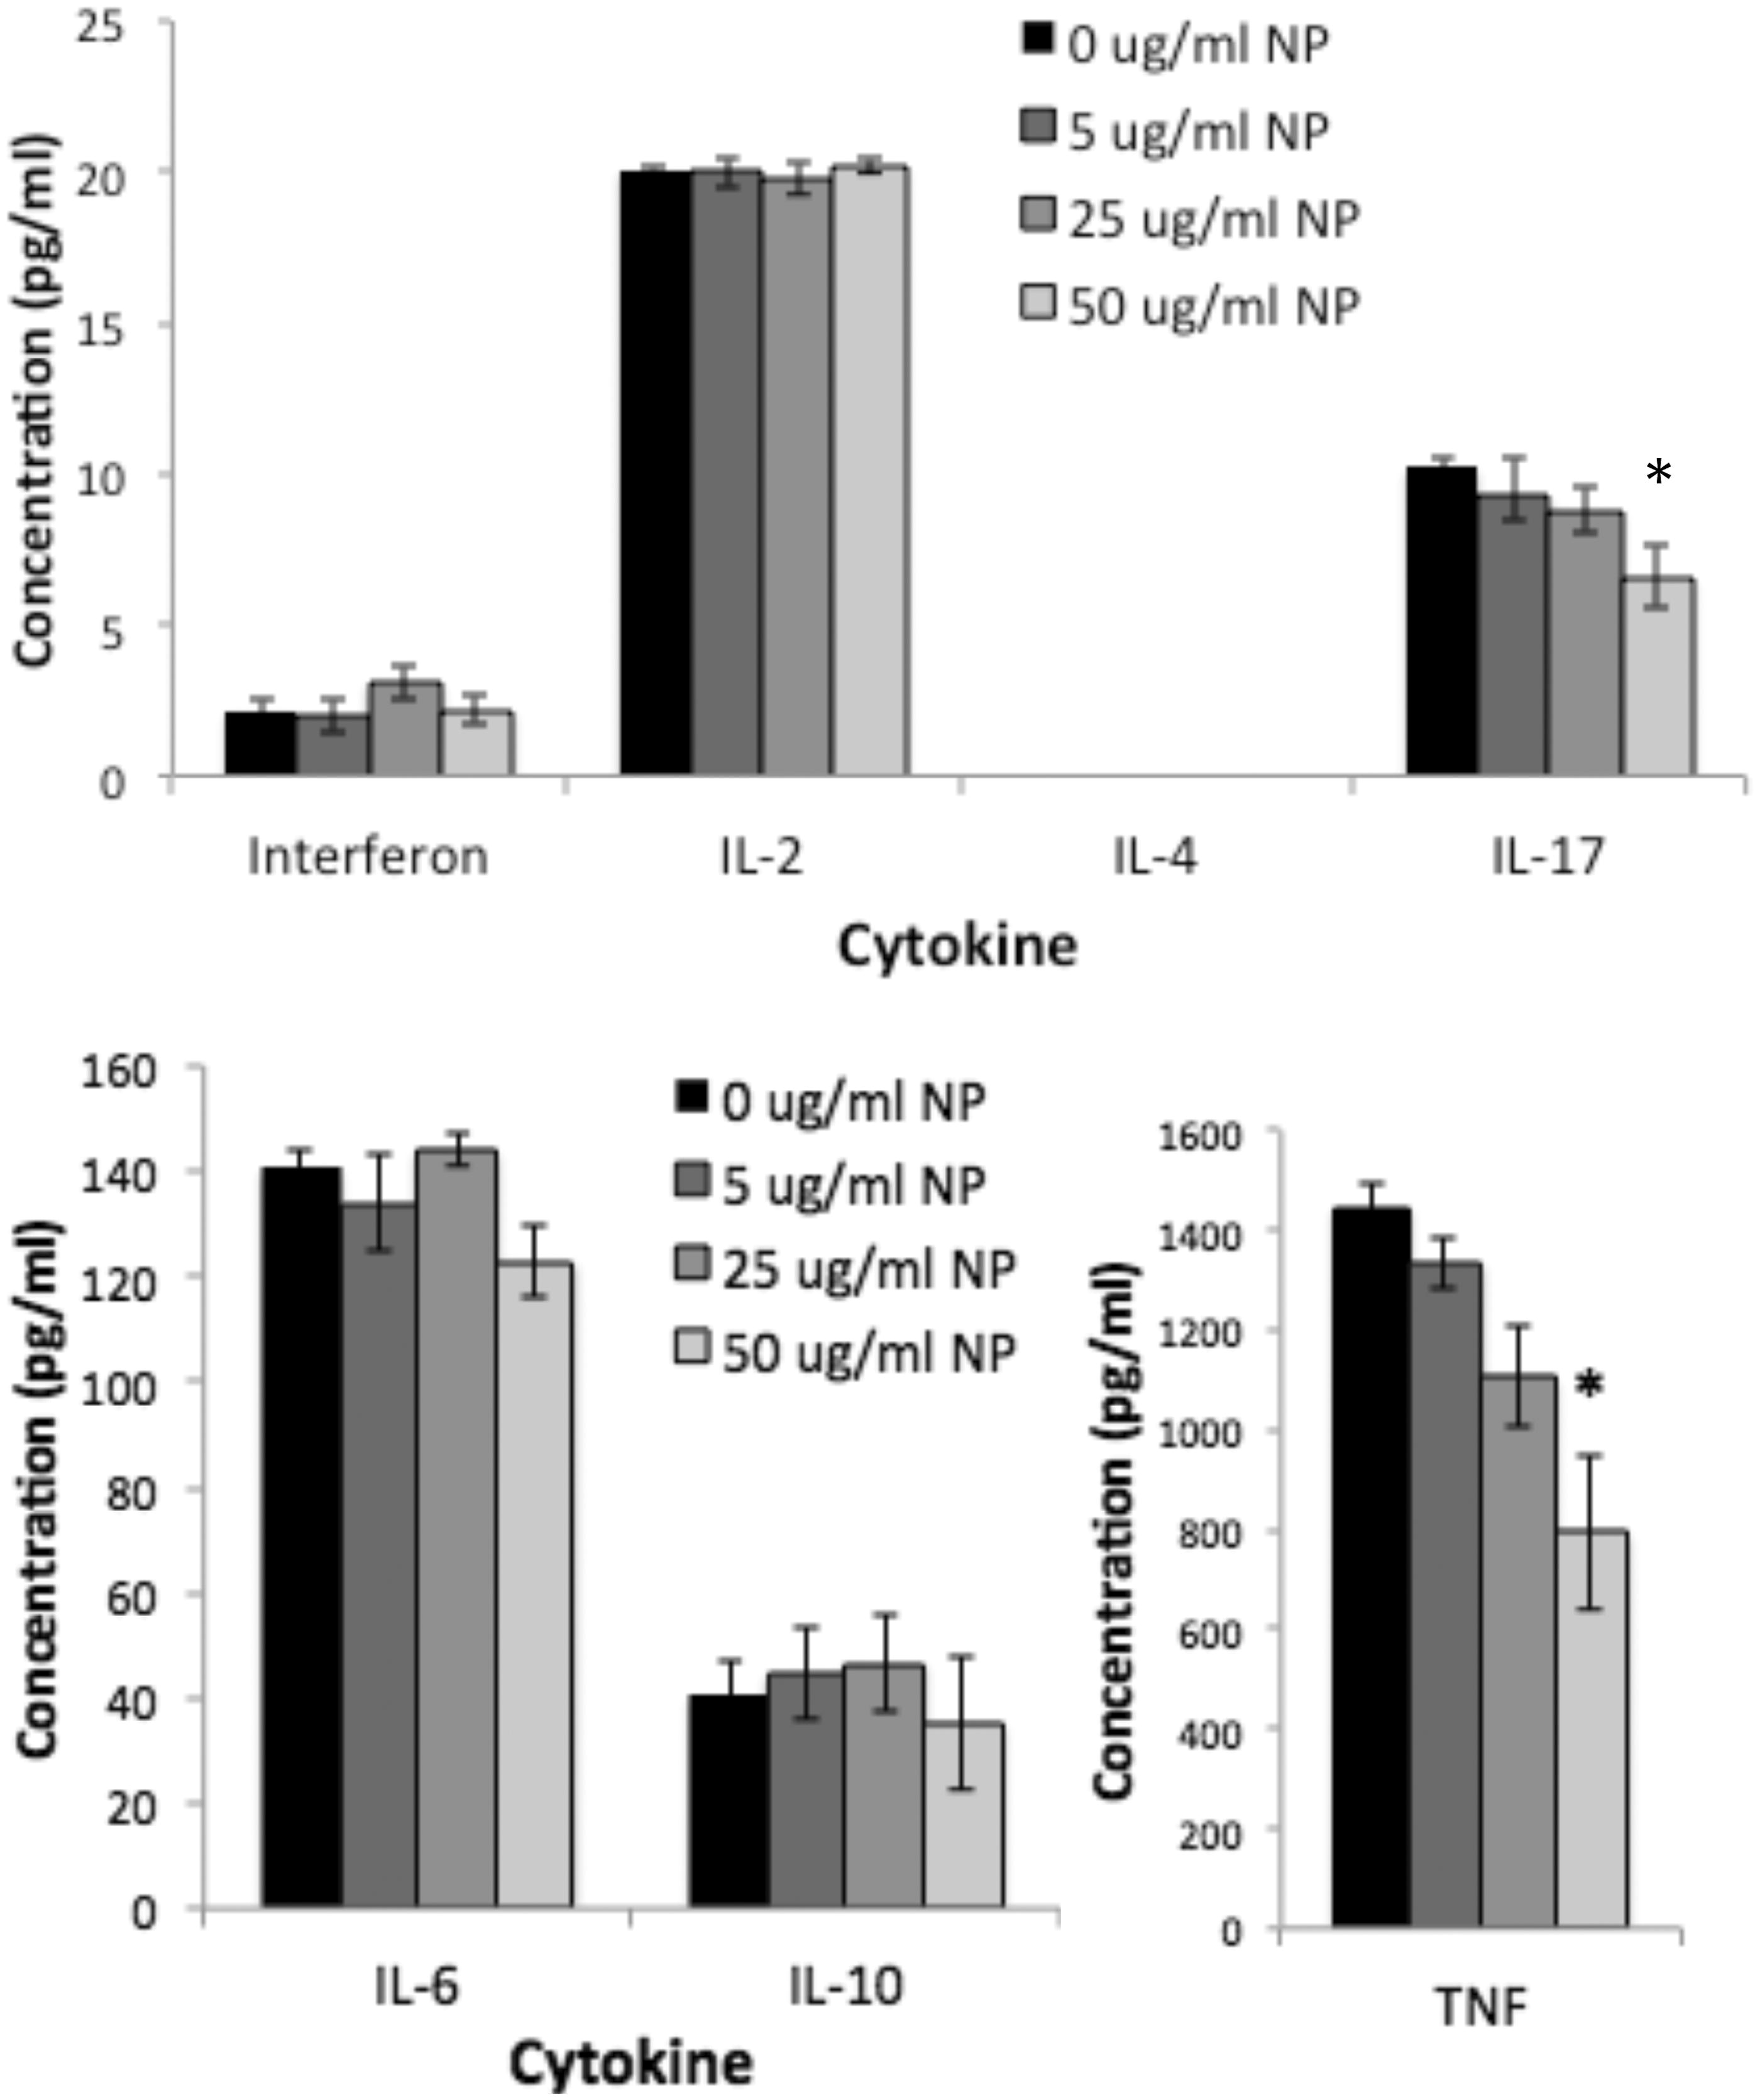
Figure 7. AuNP alone had no effect on any of the cytokines tested by CBA. Data for the seven cytokines were split into two graphs with different y-axis ranges simply because of large differences in the amounts of the different cytokines produced by these cells under control conditions. n = 4, p > 0.05 for all cytokines and all concentrations.
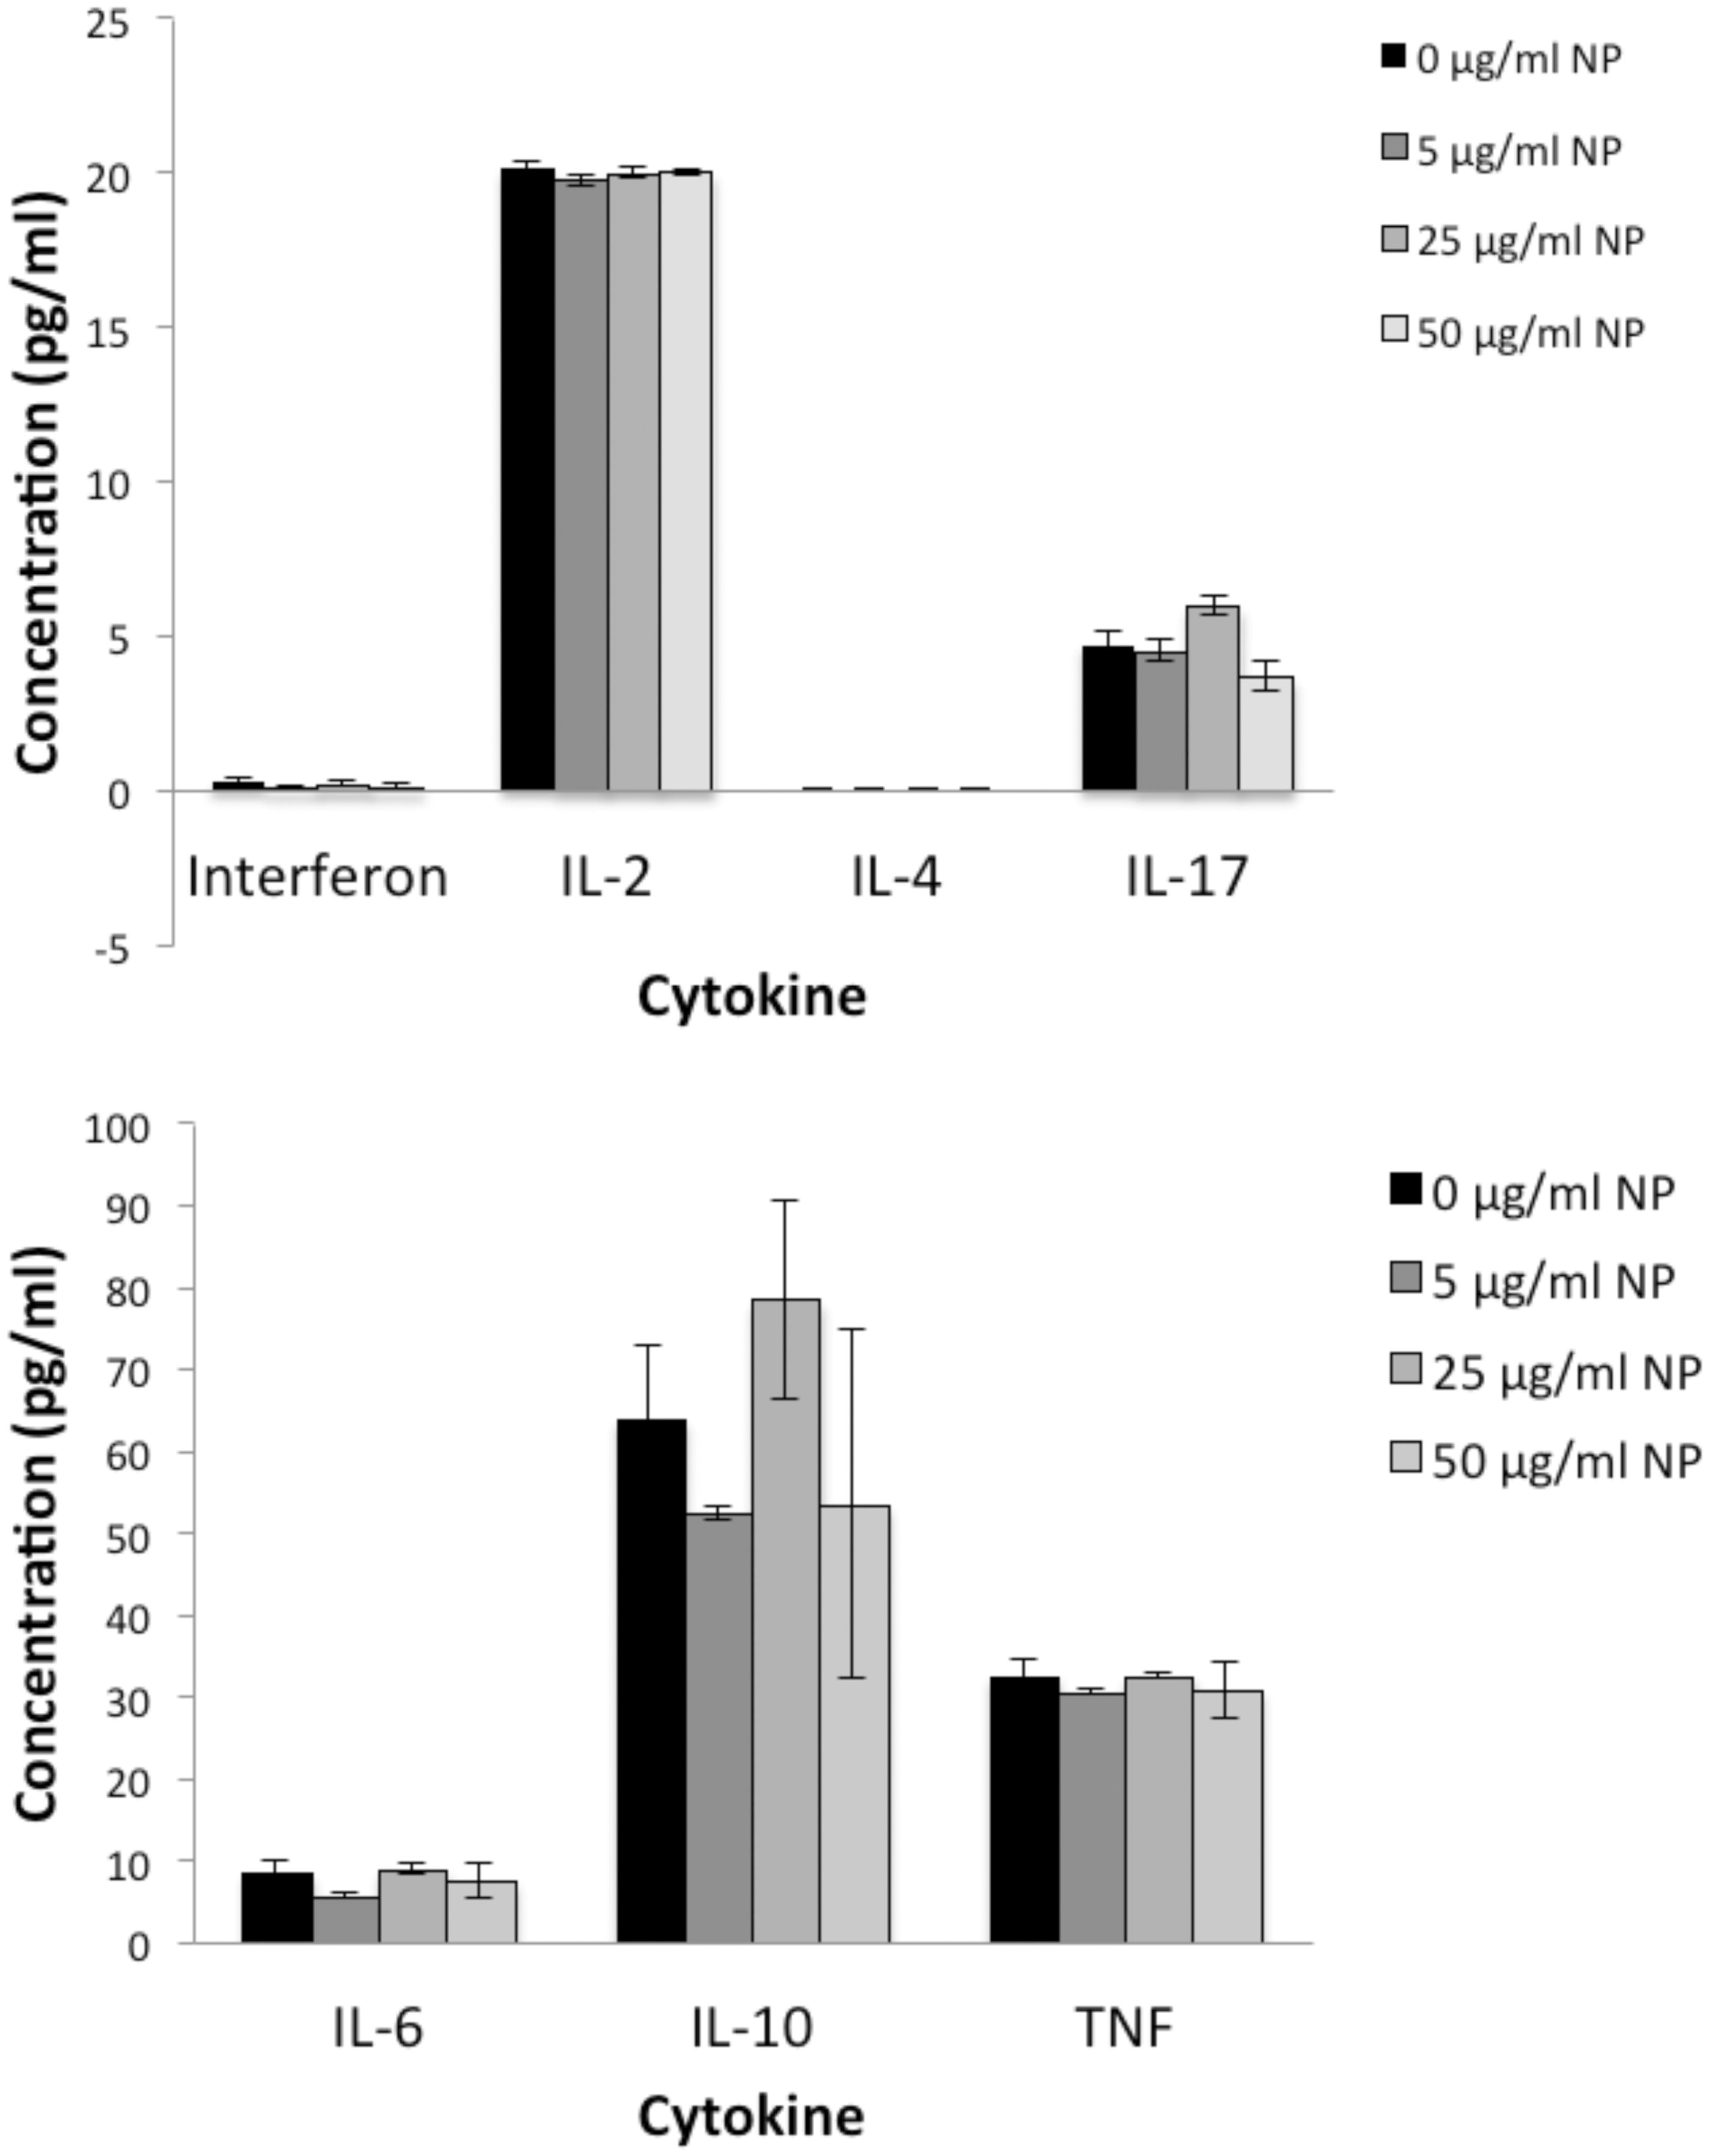
Figure 8. AuNP reduced LPS-induced IL-17 and TNFα production. LPS significantly increased production of all cytokines except IL-2 and IL-4 as compared to no LPS (shown in Figure 7). BioPure AuNP reduced levels of TNFα and IL-17 in a dose-dependent manner (p < 0.05, ANOVA). All cytokines were measured by CBA as in Figure 7. n = 4, *p < 0.01 compared to no AuNP treatment (0 µg/ml) for the particular cytokine (ANOVA, with Bonferroni post-hoc test). Separate graphs provided simply due to differences in scale for the various cytokines.