Figures & data
Figure 1. Chemical structures of UMB and MG from F. szowitsiana.
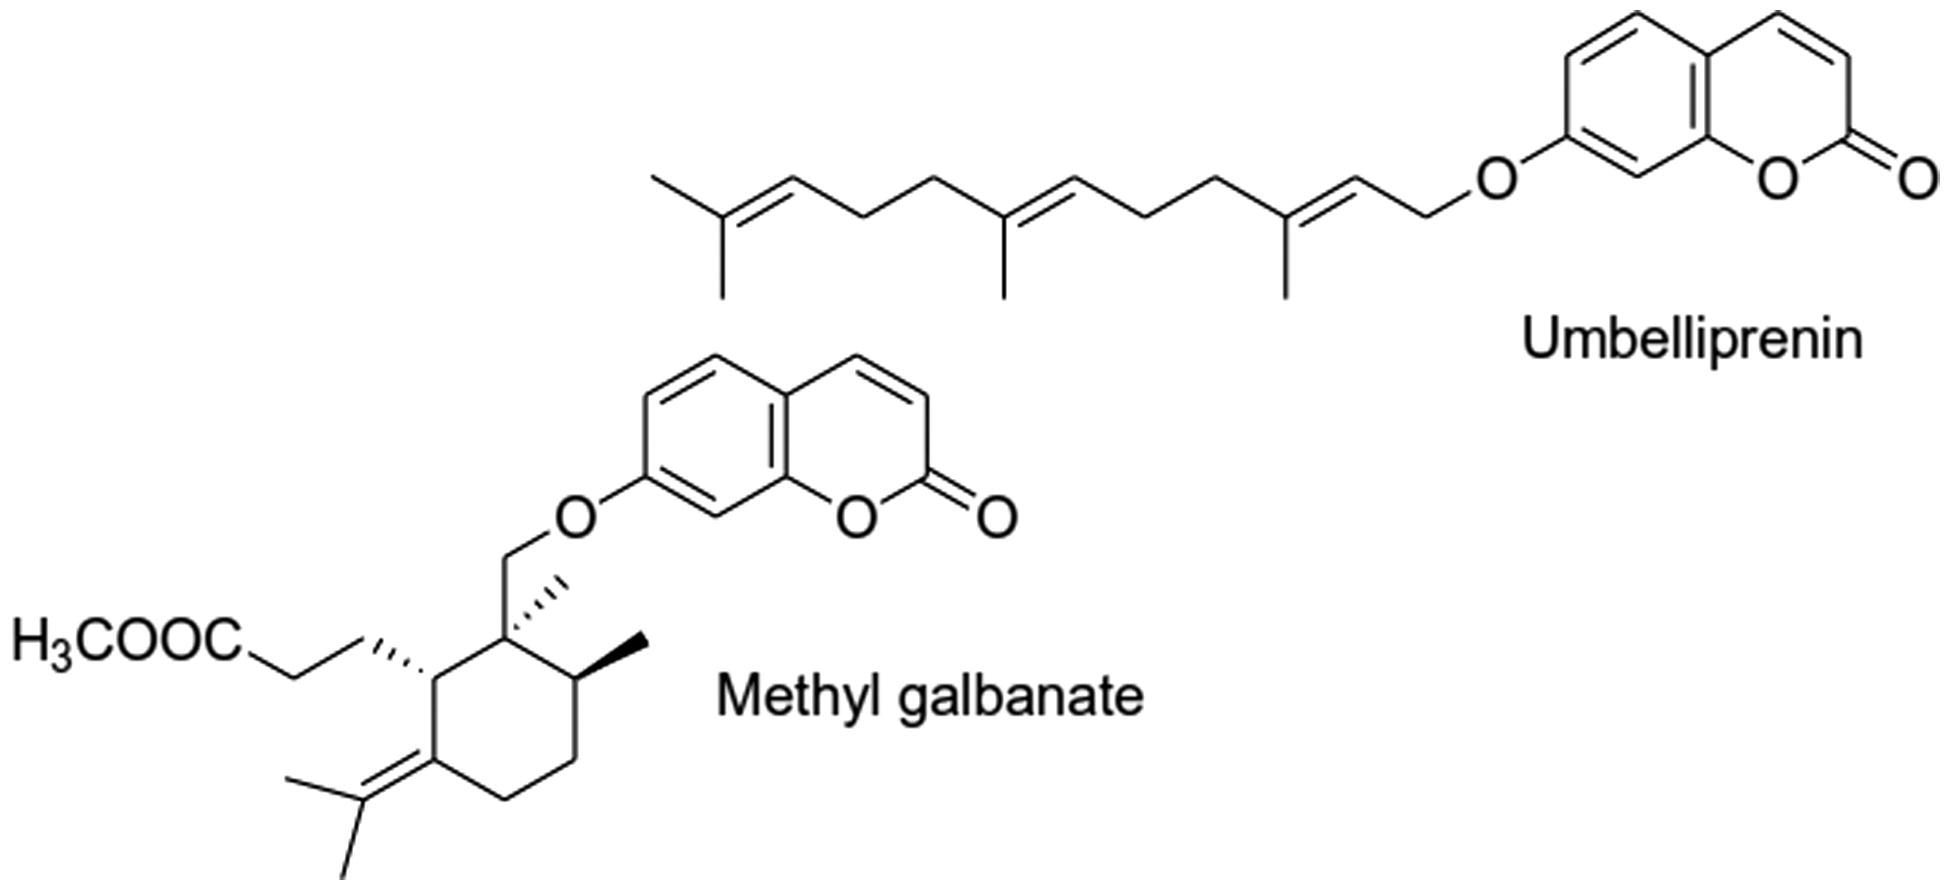
Figure 2. Effect of terpenoid coumarins on PHA-stimulated splenocyte proliferation. Proliferation of naïve cells exposed to 0.5–15 μM of UMB or MG was measured using MTT method. Results are shown as mean SI values ± SD. Values significantly different versus “0” terpenoid control: *p < 0.05, **p < 0.01 and ***p < 0.001. Values for a fixed dose of UMB and MG significantly differed (p < 0.05) at all doses ≥2.5 µM.
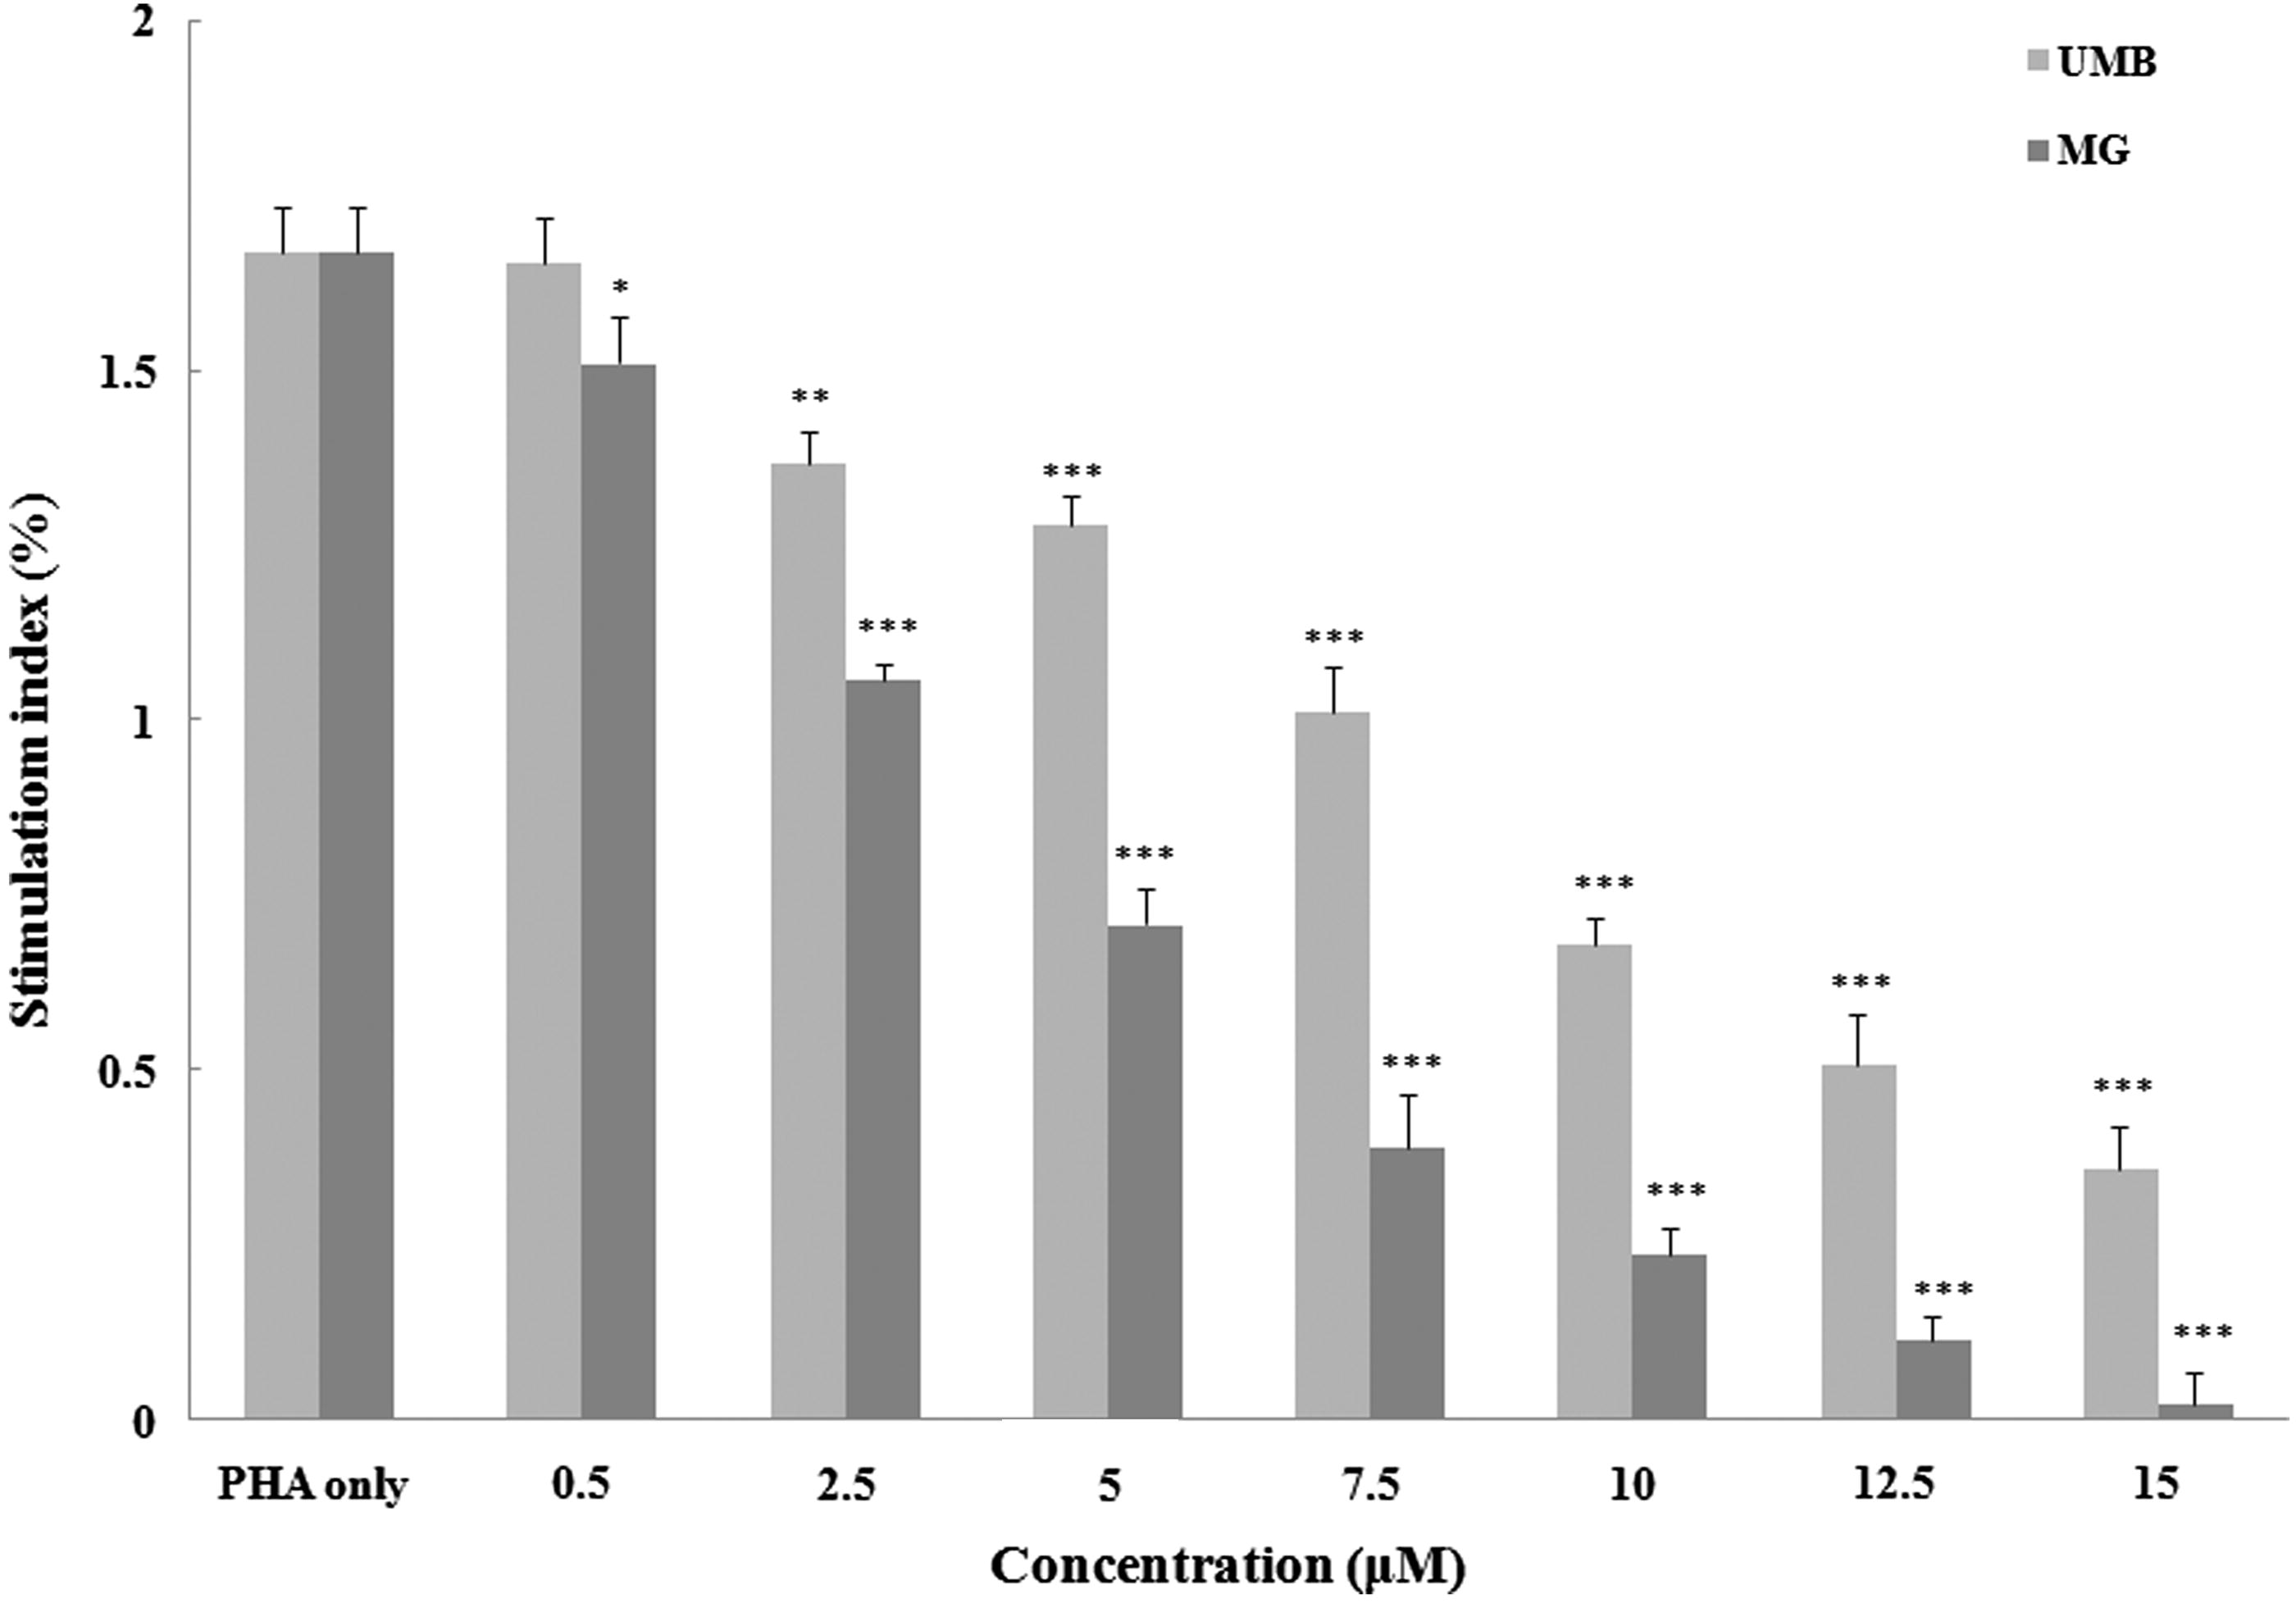
Figure 3. Effect of terpenoid coumarins on cytokine production by murine splenocytes. (a) IFNγ and (b) IL-4. Naïve mouse splenocytes were treated with PHA (5 ng/ml) ± 0.5–15 μM of UMB or MG for 72 h at 37 °C before culture supernatants were collected for analysis. Results shown are mean ± SD (pg/ml). Values significantly different vs “0” terpenoid control: *p < 0.05, **p < 0.01 and ***p < 0.001. Values for a fixed dose of UMB and MG significantly differed (p < 0.05) at all doses ≥5 µM.
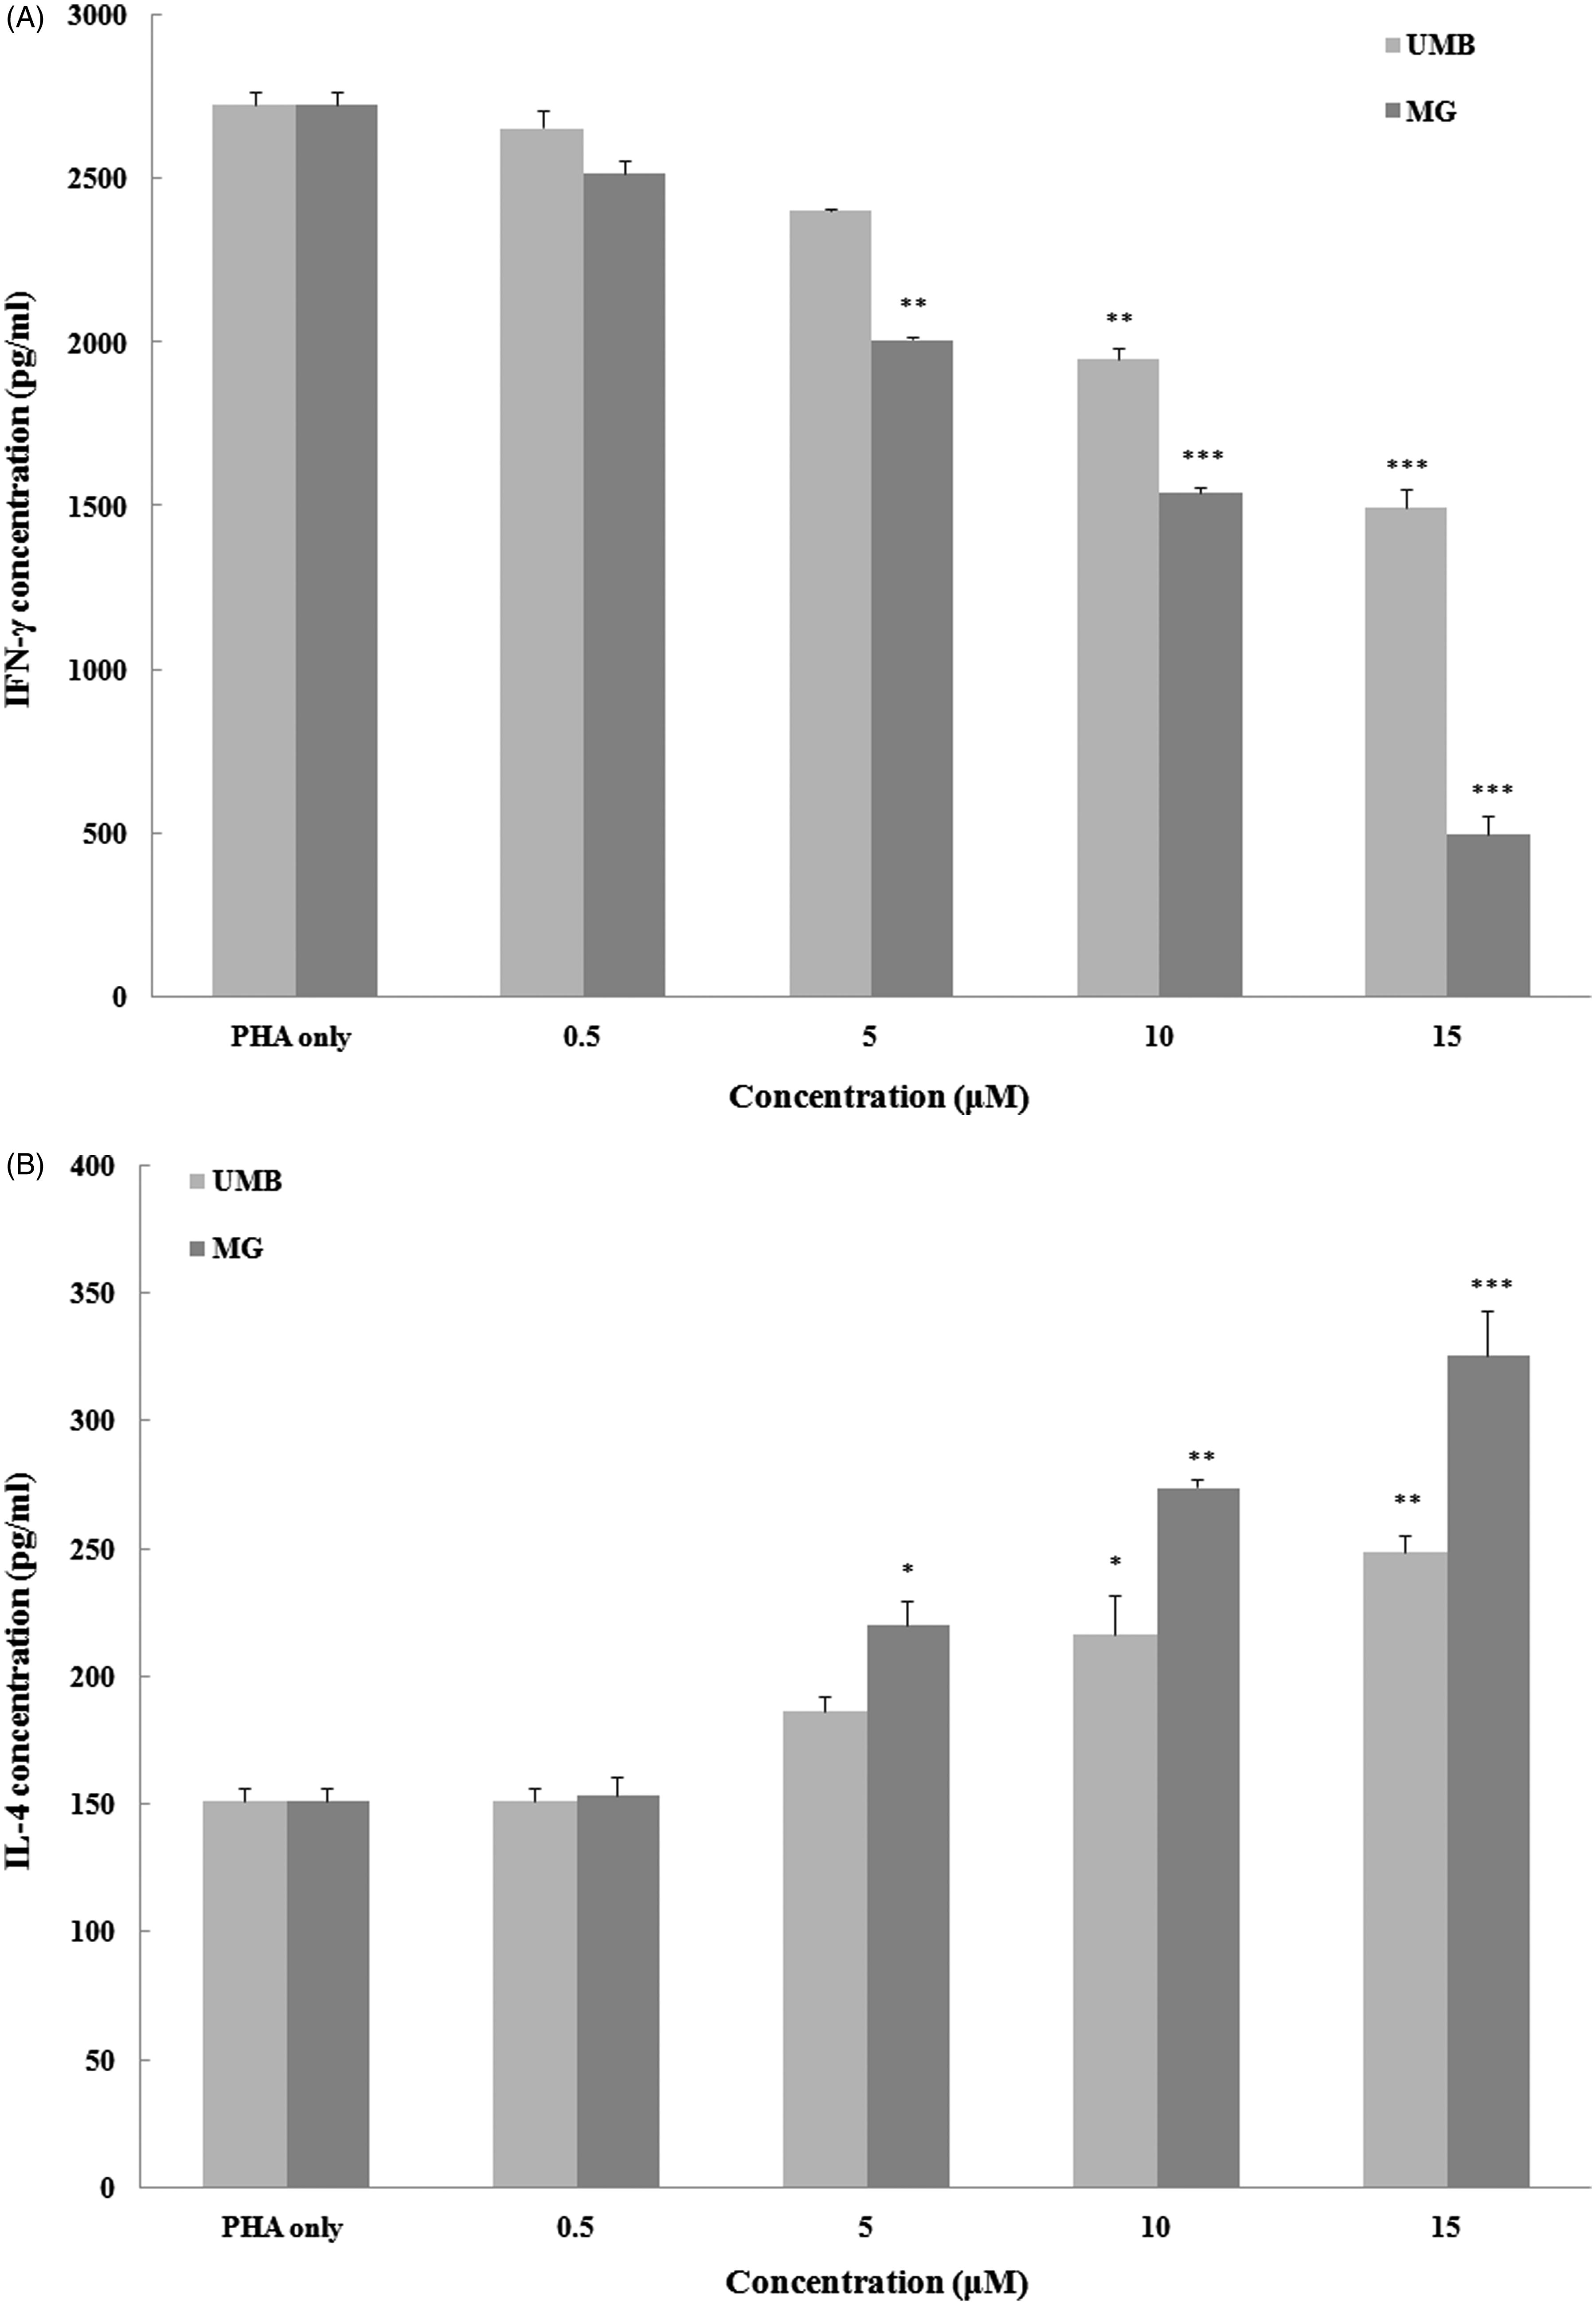
Figure 4. Effect of terpenoid coumarins on peritoneal macrophage viability. Naïve macrophages were cultured with either UMB or MG (5–40 μM) for 24 h before viability was assessed using MTT. Results are shown as mean ± SD (% viability). Values significantly different versus “0” terpenoid control: Values for a fixed dose of UMB and MG only significantly differed (p < 0.05) at the two highest doses tested.
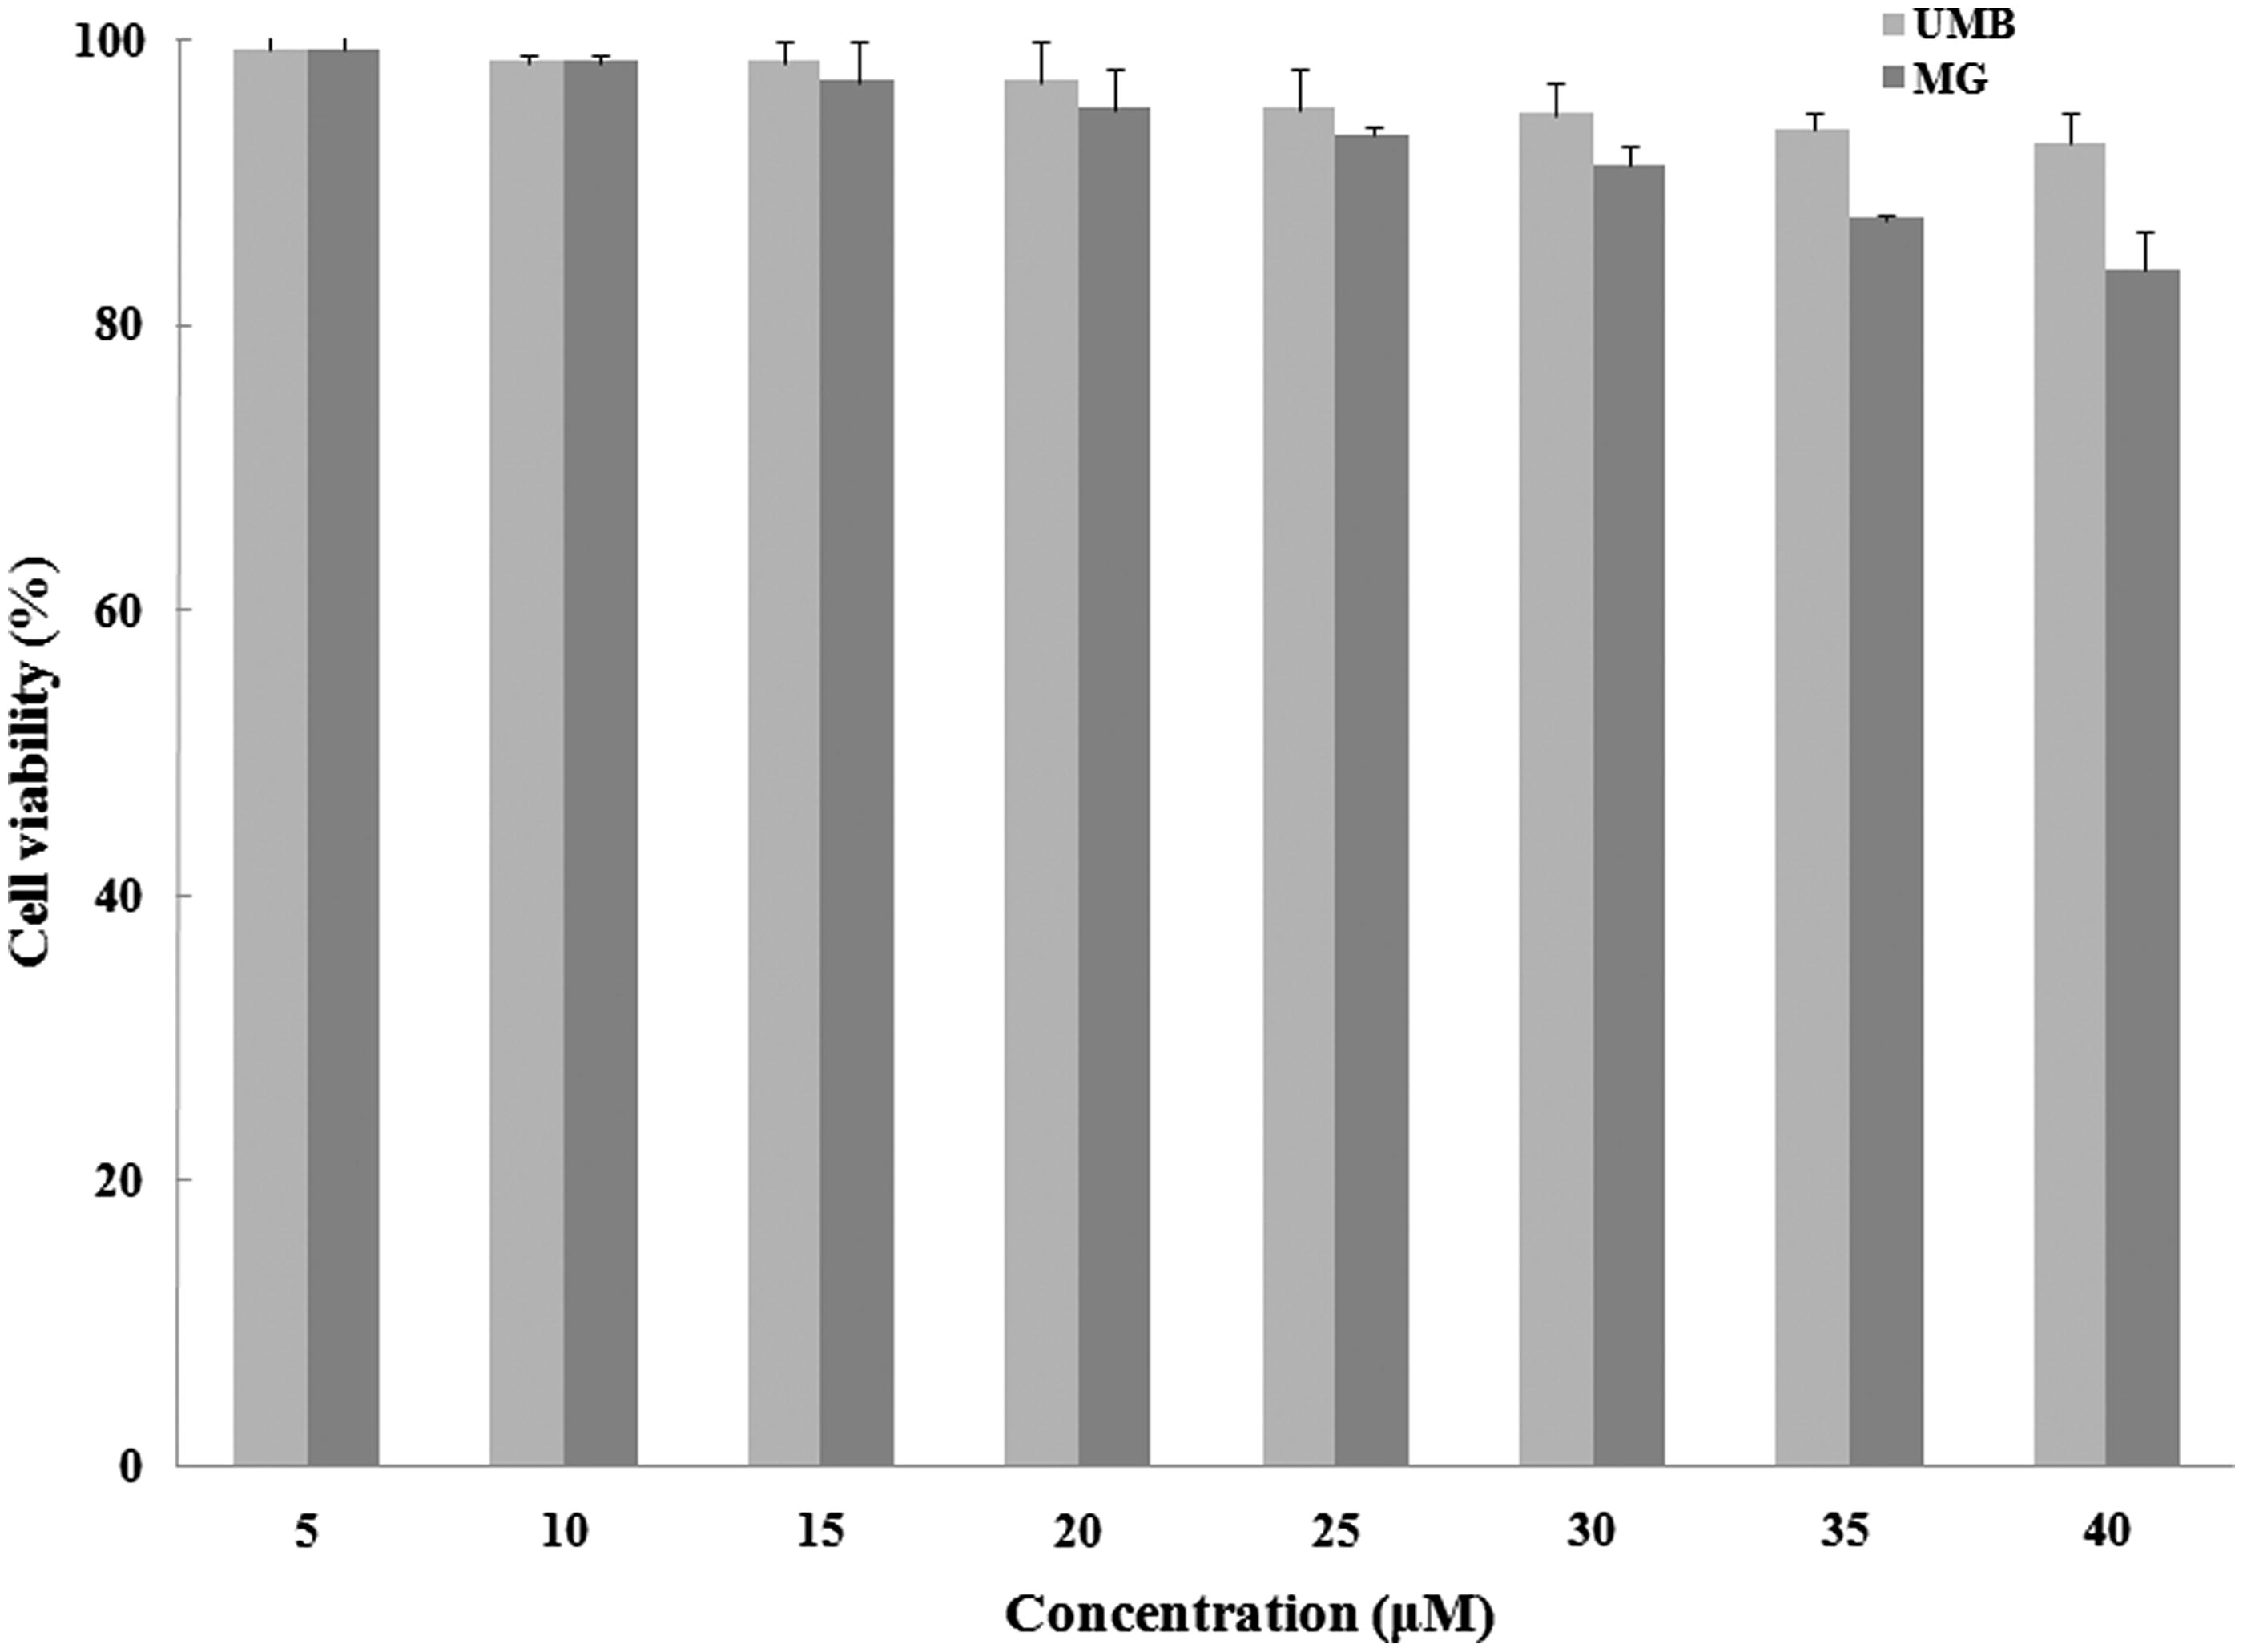
Figure 5. Effect of terpenoid coumarins on peritoneal macrophage nitric oxide production. Naïve macrophages were stimulated with LPS (10 ng/ml) and IFNγ (100 ng/ml) ± UMB or MG (5–40 μM) for 24 h at 37 °C before culture supernatants were collected for analysis. Results are shown as mean ± SD (µM). Values significantly different vs “0” terpenoid control: *p < 0.05, **p < 0.01 and ***p < 0.001. Values for a fixed dose of UMB and MG significantly differed (p < 0.05) at all doses tested.
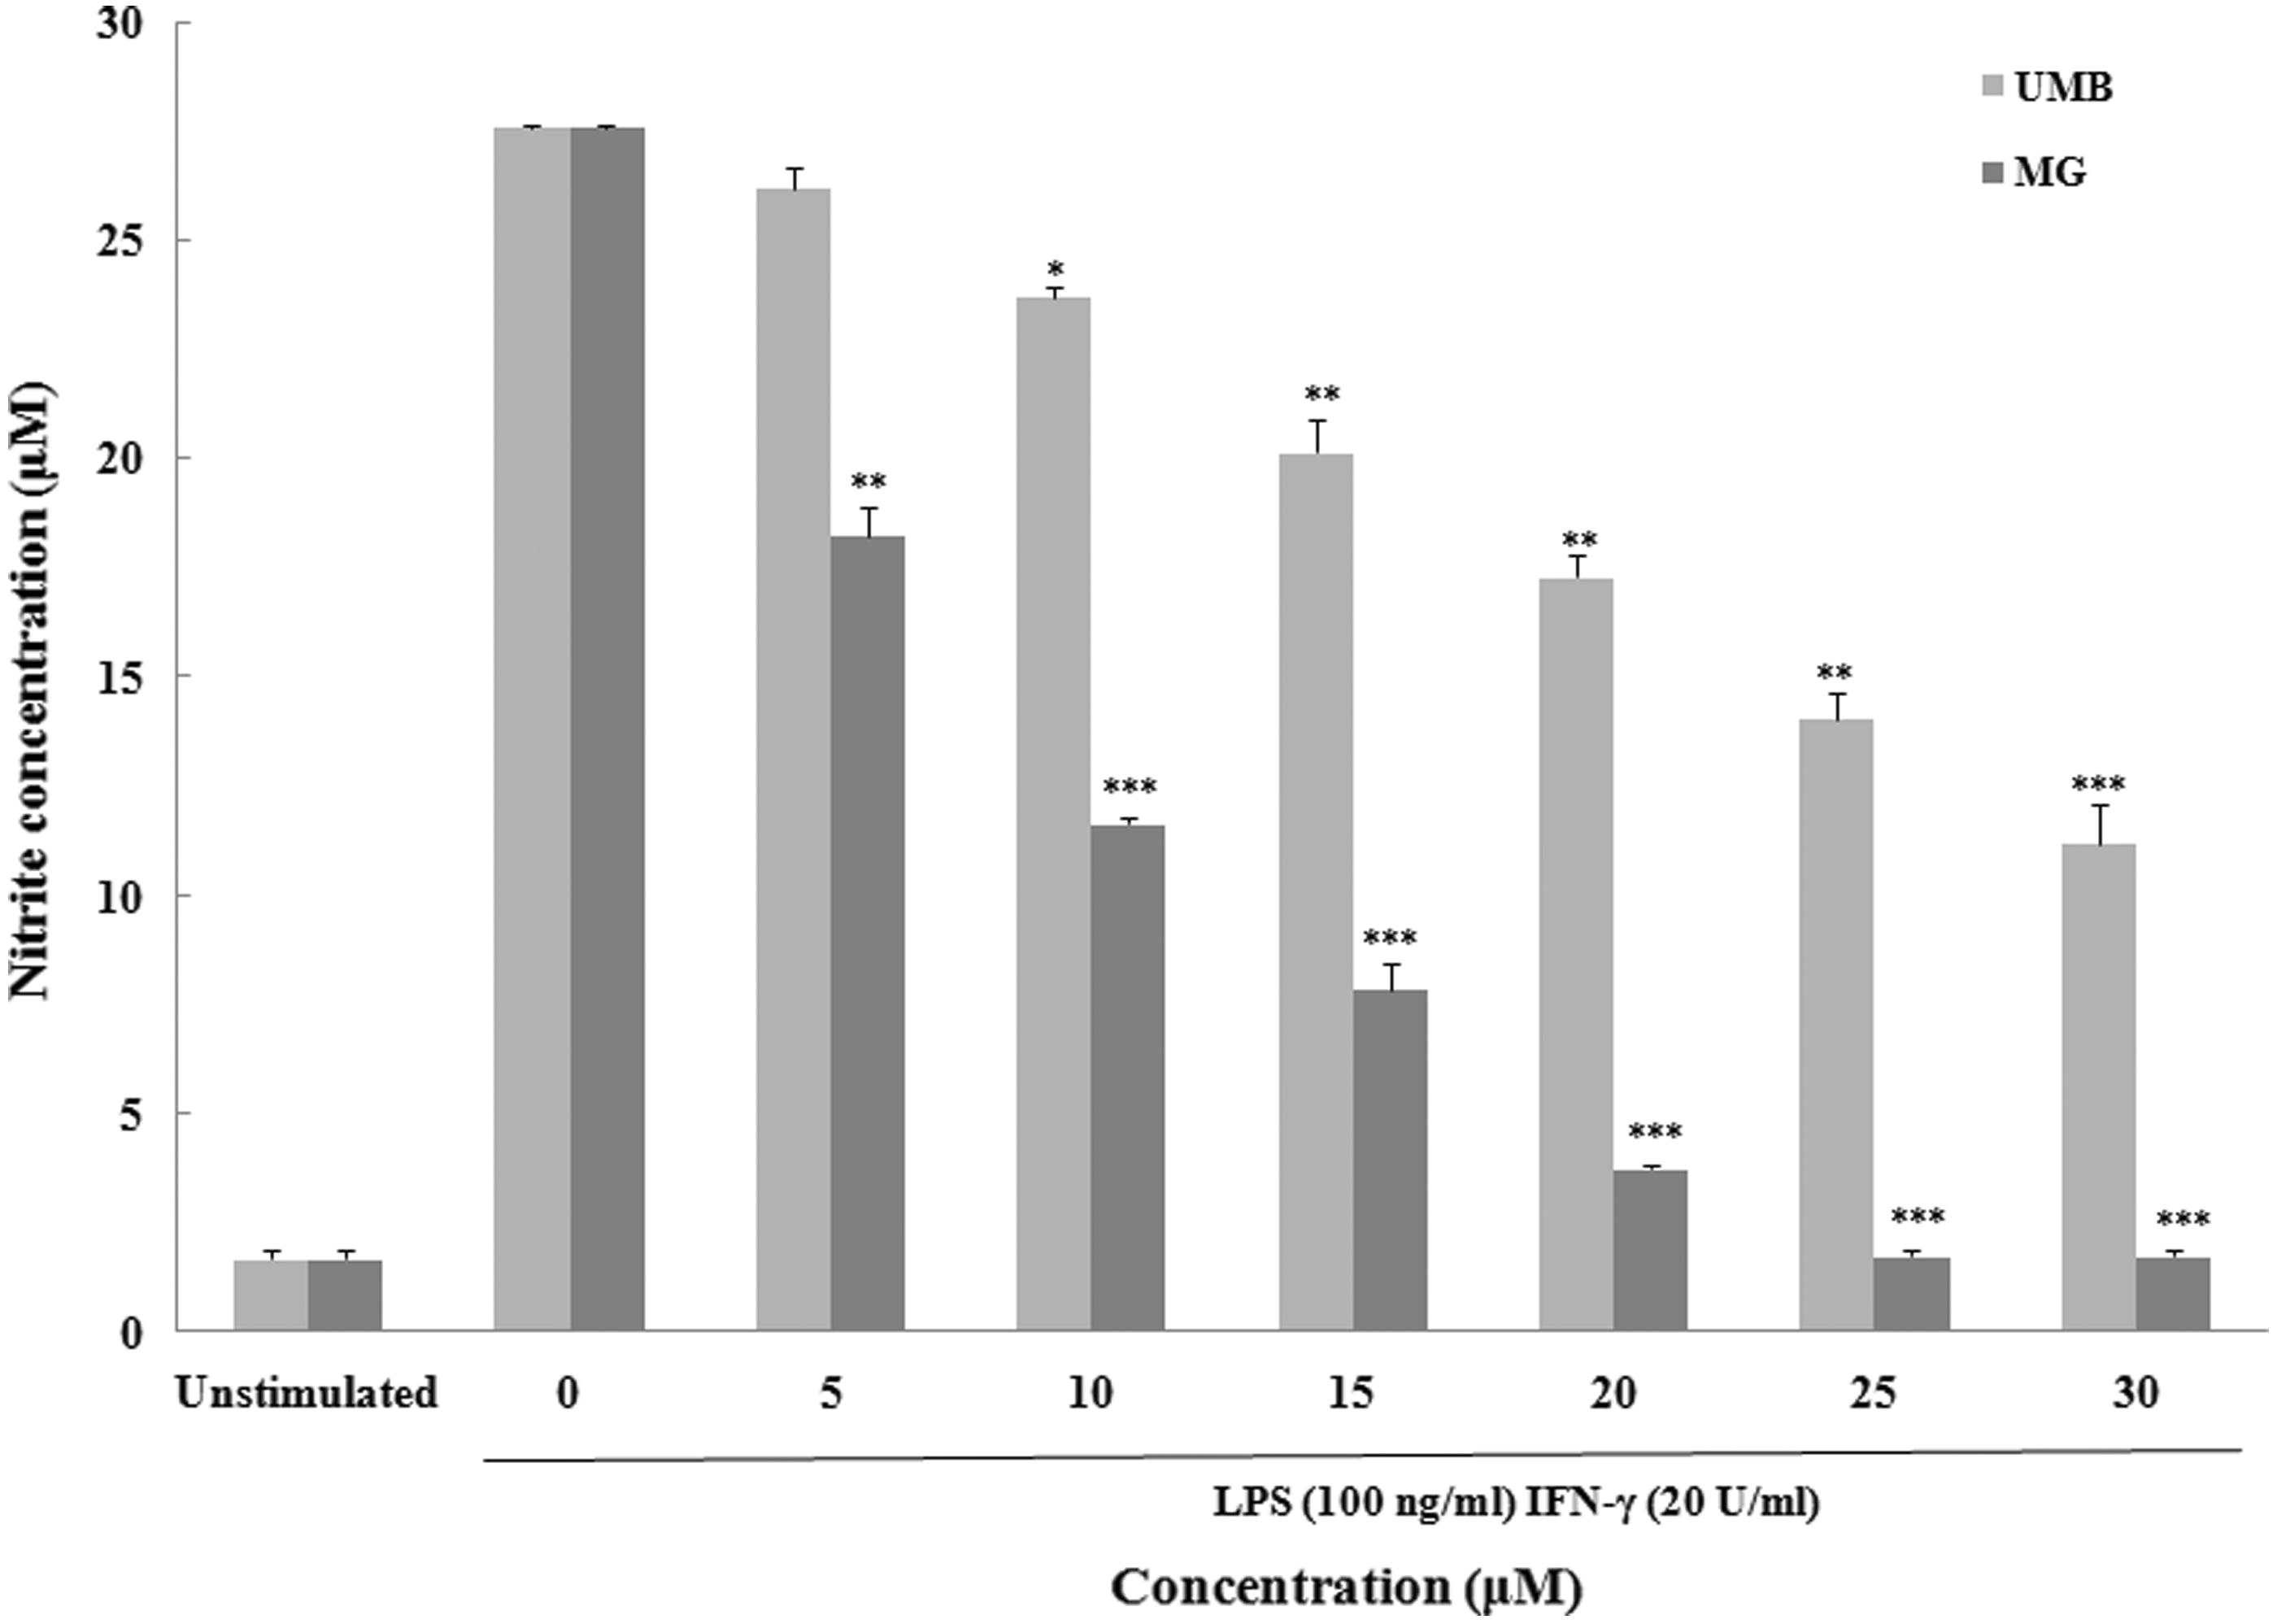
Figure 6. Effect of terpenoid coumarins on peritoneal macrophage PGE2 production Naïve macrophages were stimulated with LPS (10 ng/ml) and IFNγ (100 ng/ml) ± UMB or MG (5–40 μM) for 24 h at 37 °C before culture supernatants were collected for analysis. Results are shown as mean ± SD (µM). Values significantly different vs “0” terpenoid control: *p < 0.05, **p < 0.01 and ***p < 0.001. Values for a fixed dose of UMB and MG significantly differed (p < 0.05) at all doses tested.
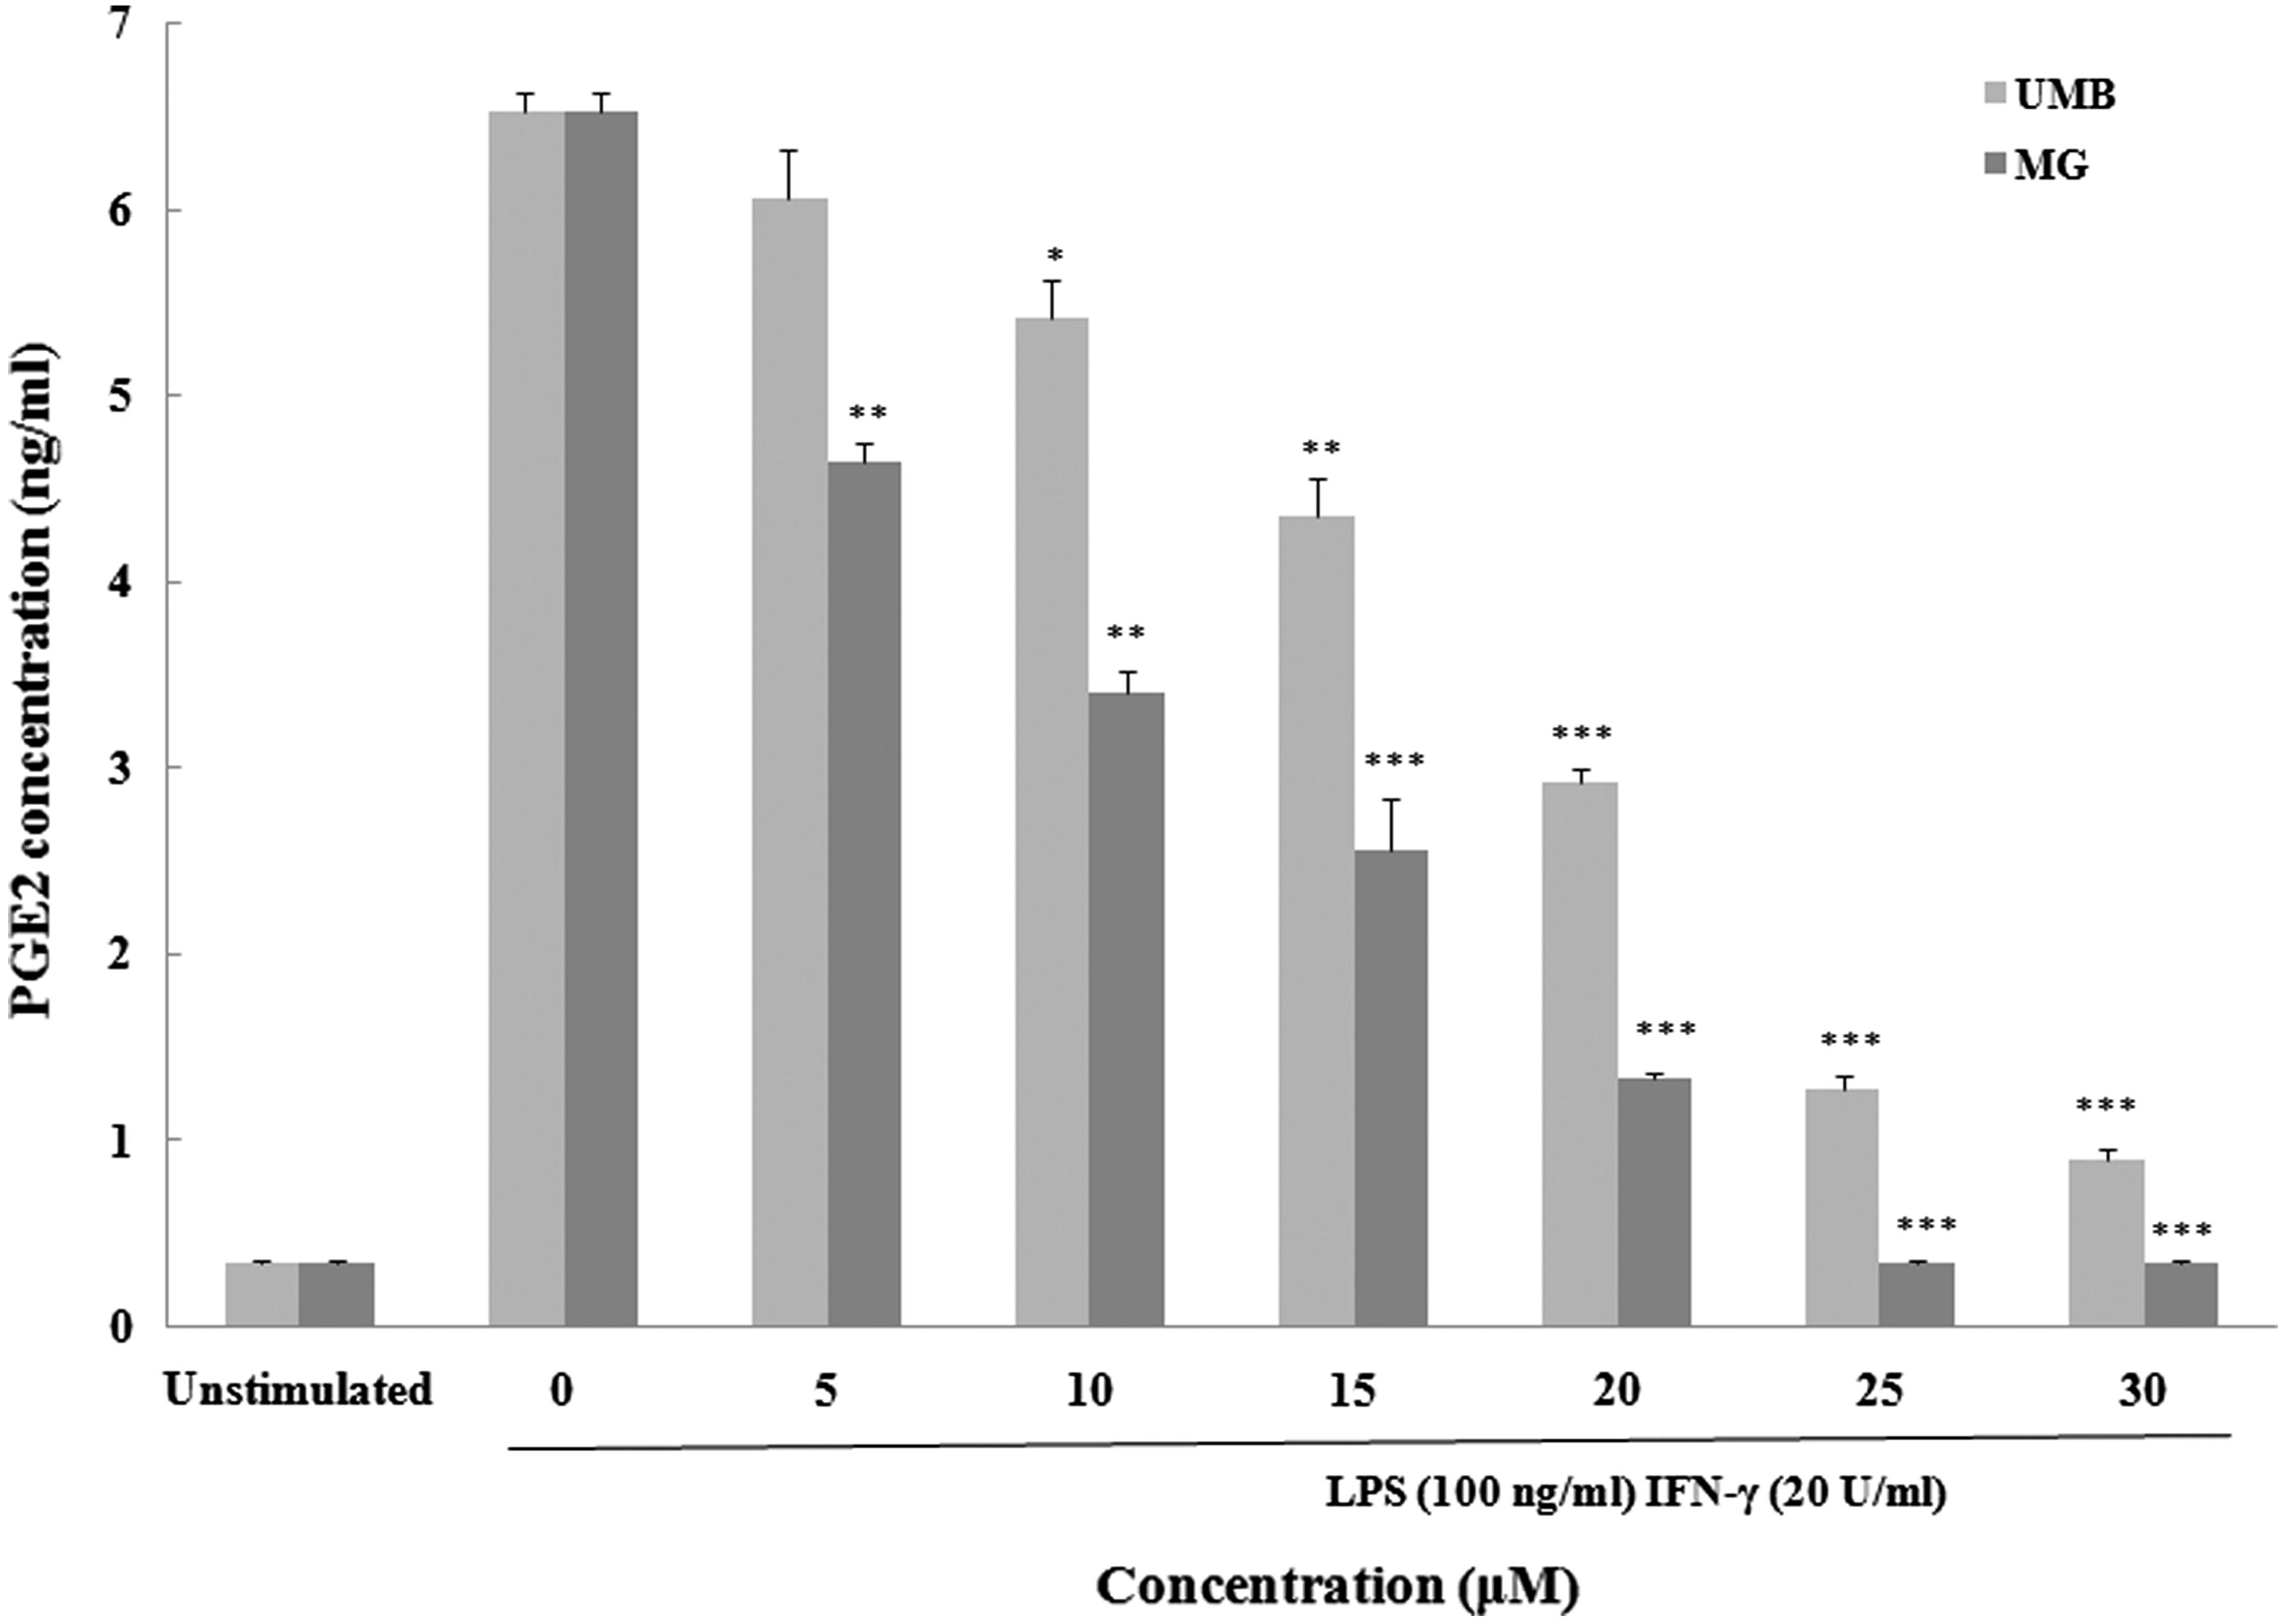
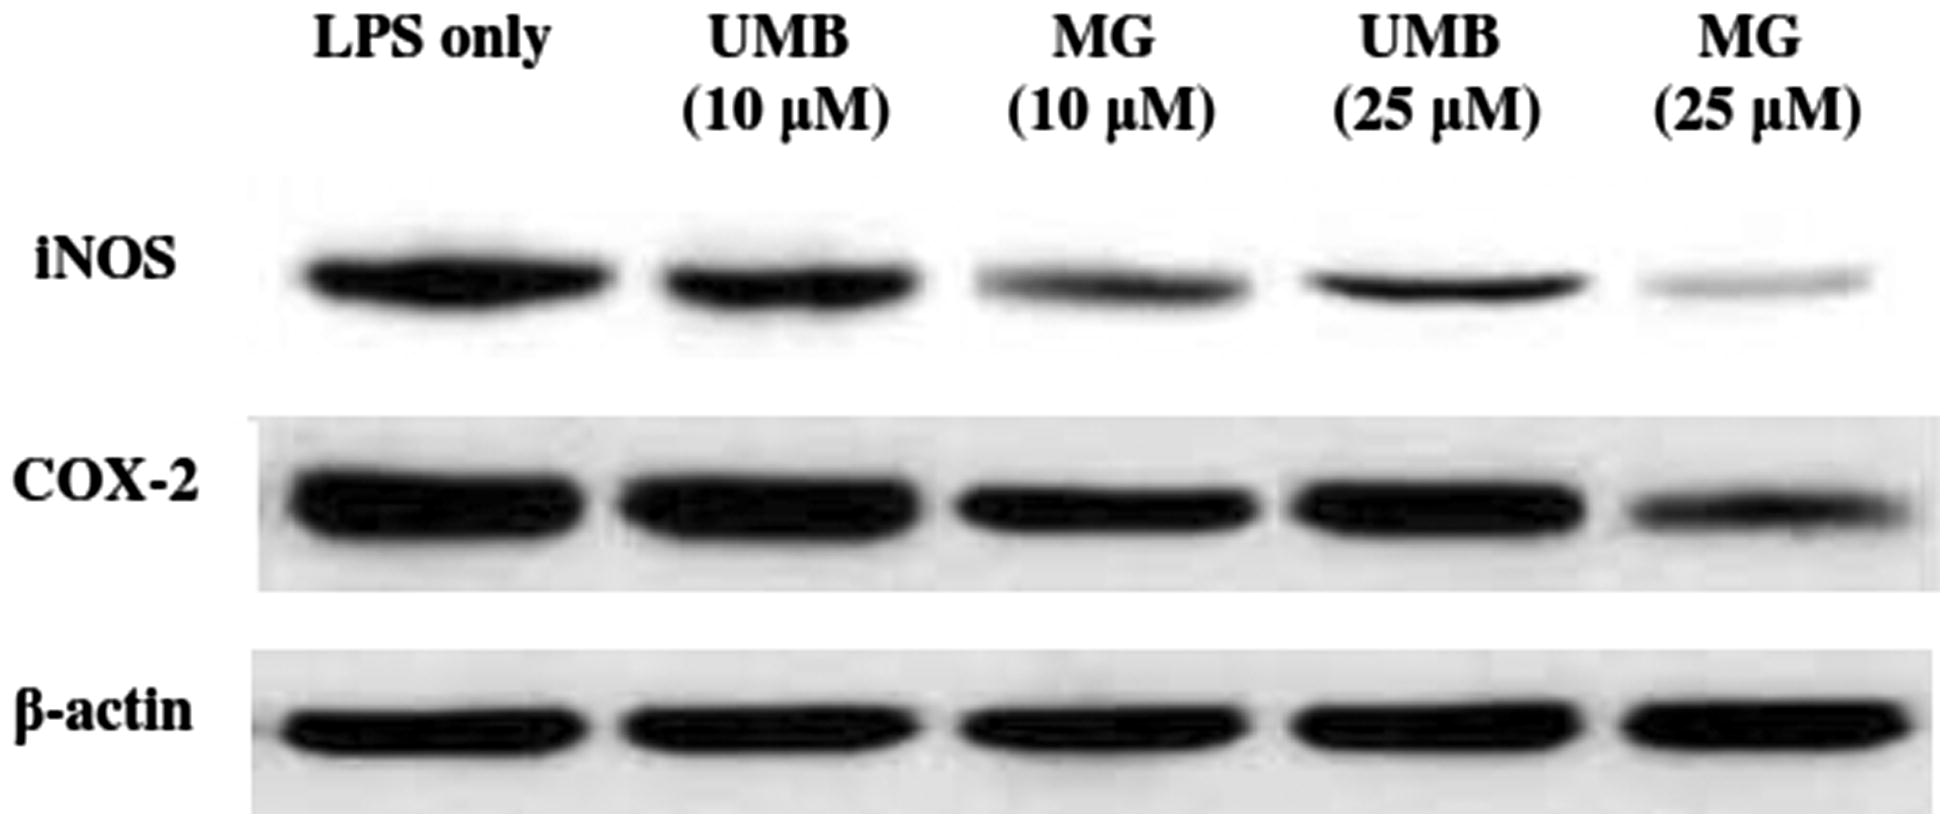
Figure 7. Effect of UMB and MG (10 and 25 μM) on LPS-/IFNγ-induced iNOS, COX-2 and β-actin expression in cultured macrophages. Lysates were prepared from macrophages incubated for 24 h with LPS (10 ng/ml) + IFNγ (100 ng/ml) alone or in combination with test terpenoid coumarins. Cell lysates were then isolated and subjected to Western blot analyses as outlined in Methods. Picture shown is a representative blot from each indicated regimen.