Figures & data
Figure 1. Identified and non-identified causes for RM. Information adapted from Ford and Schust (Citation2009).
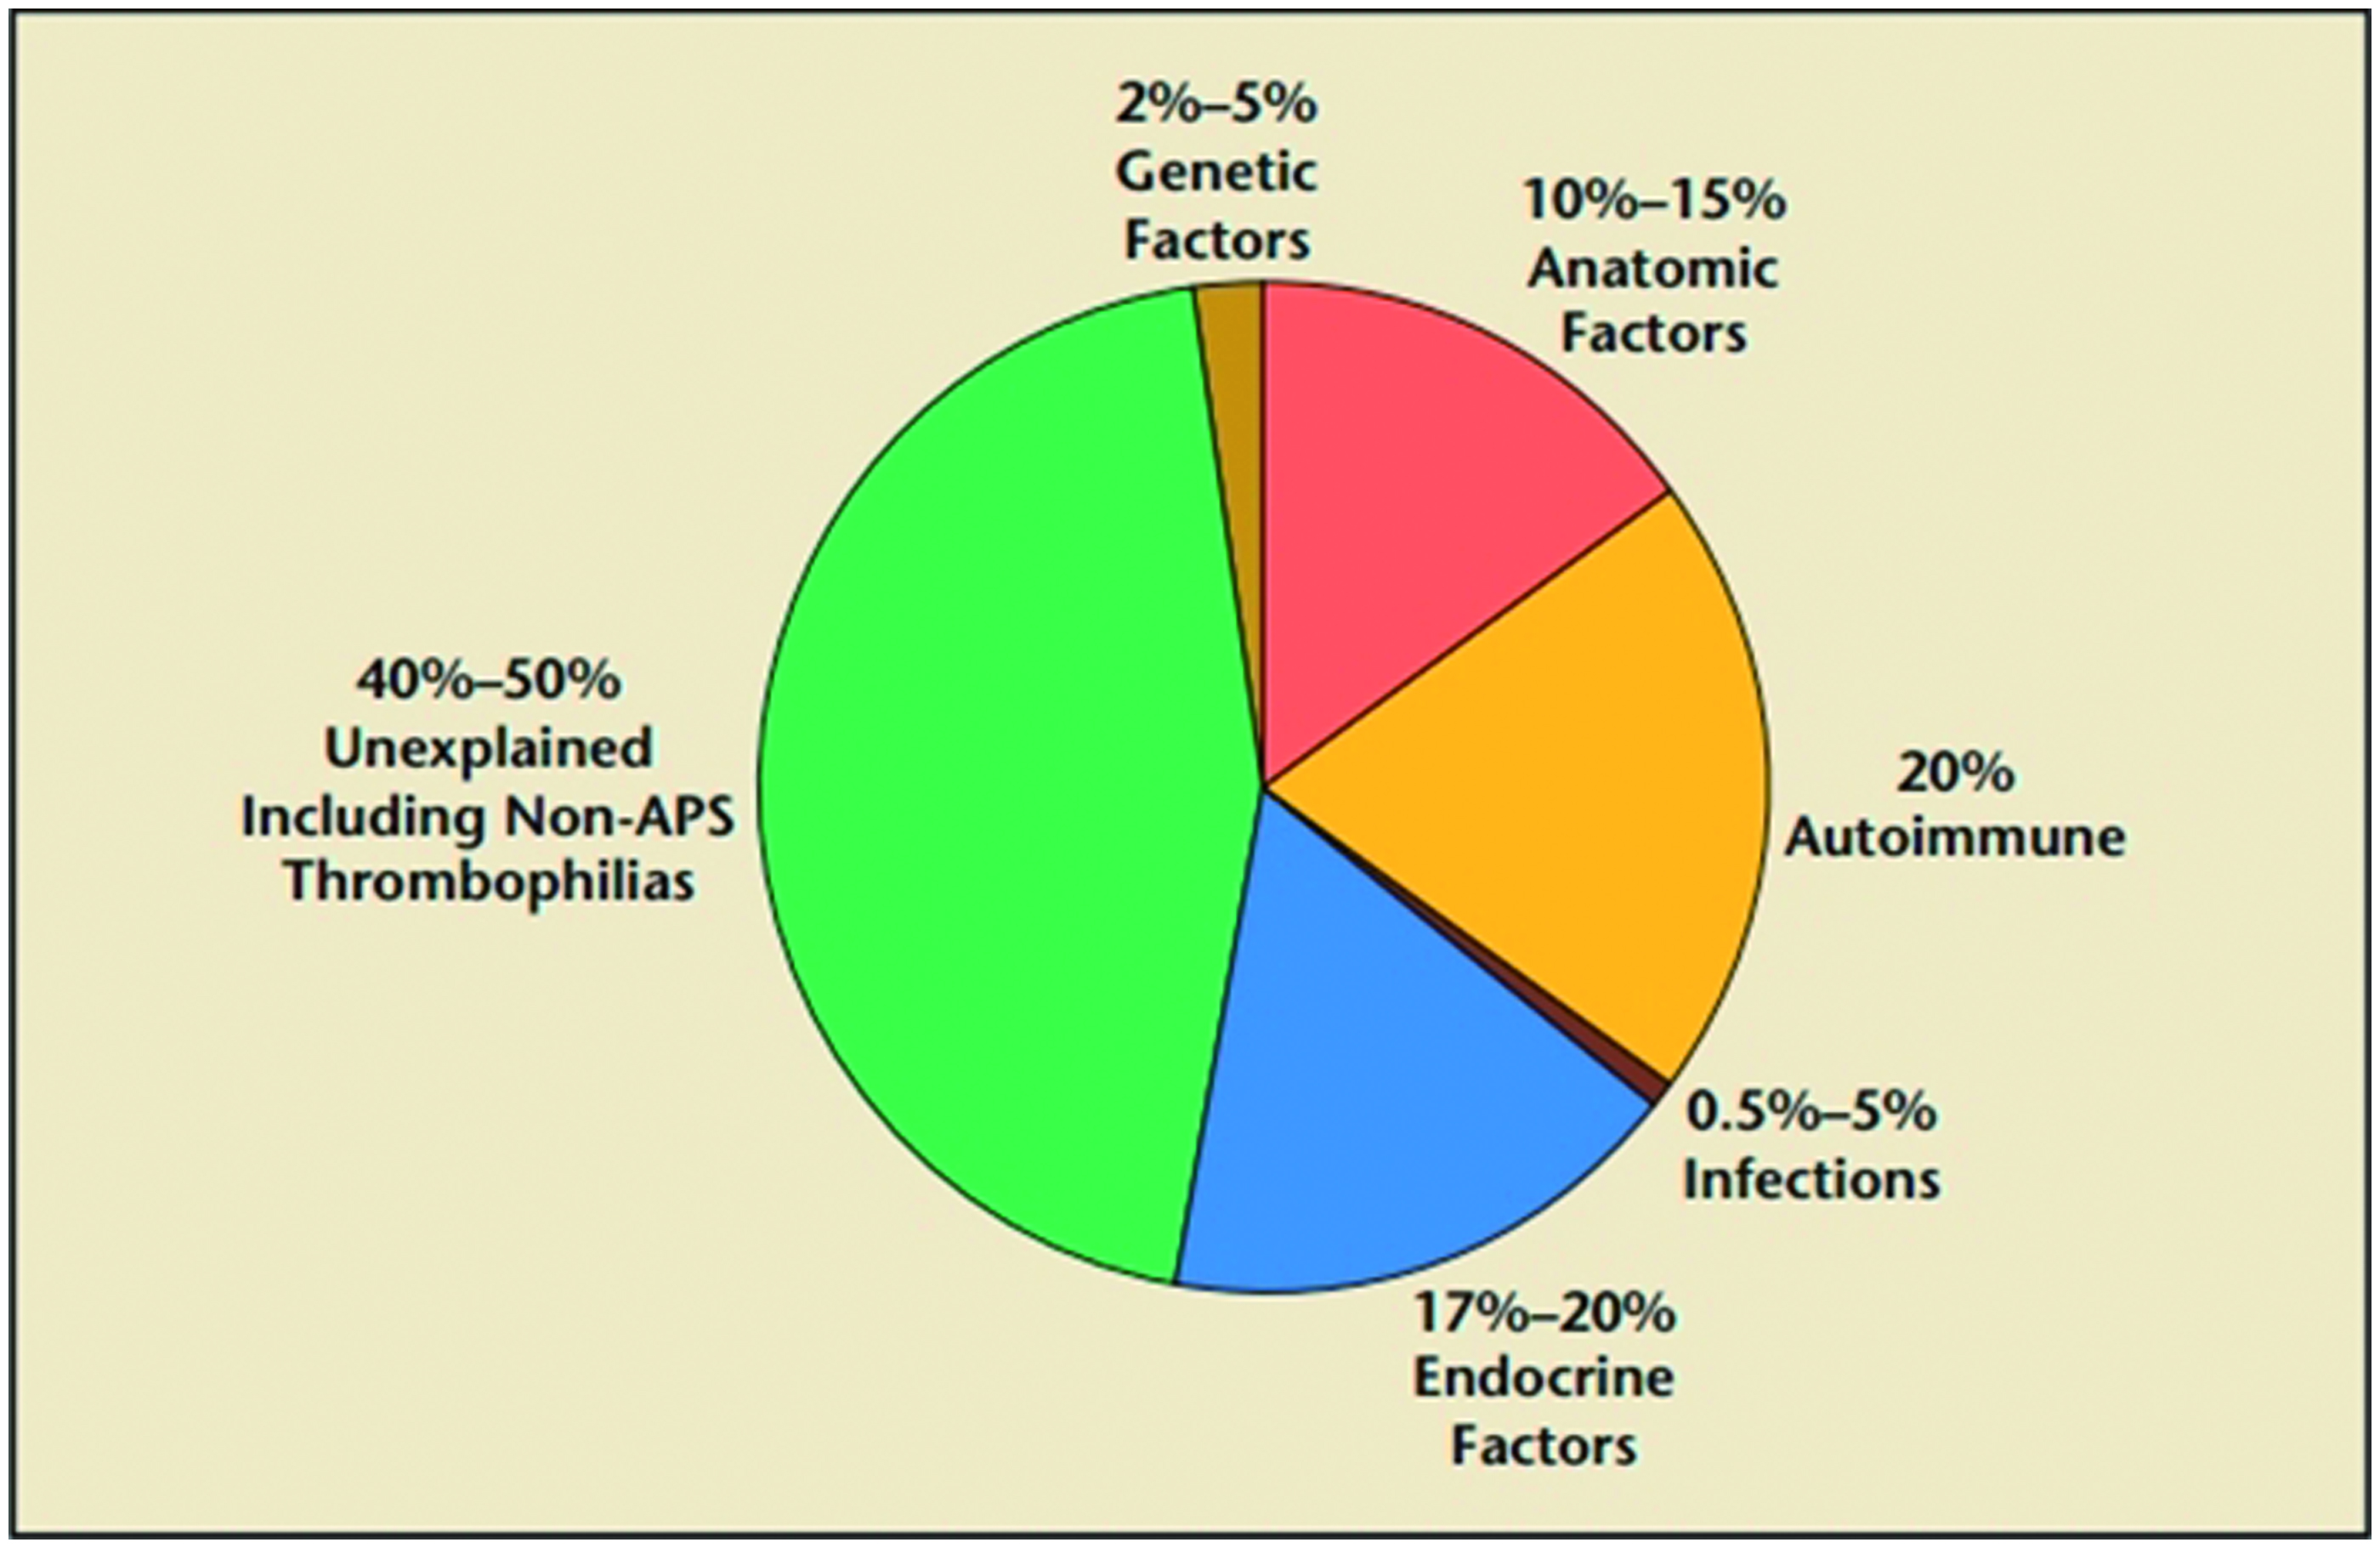
Figure 2. Inhibitory receptors associated with HLA-G. Schematic illustrates how ILT2 and KIR2DL4/HLA-G interactions can lead to inhibition of NK-cell functions.
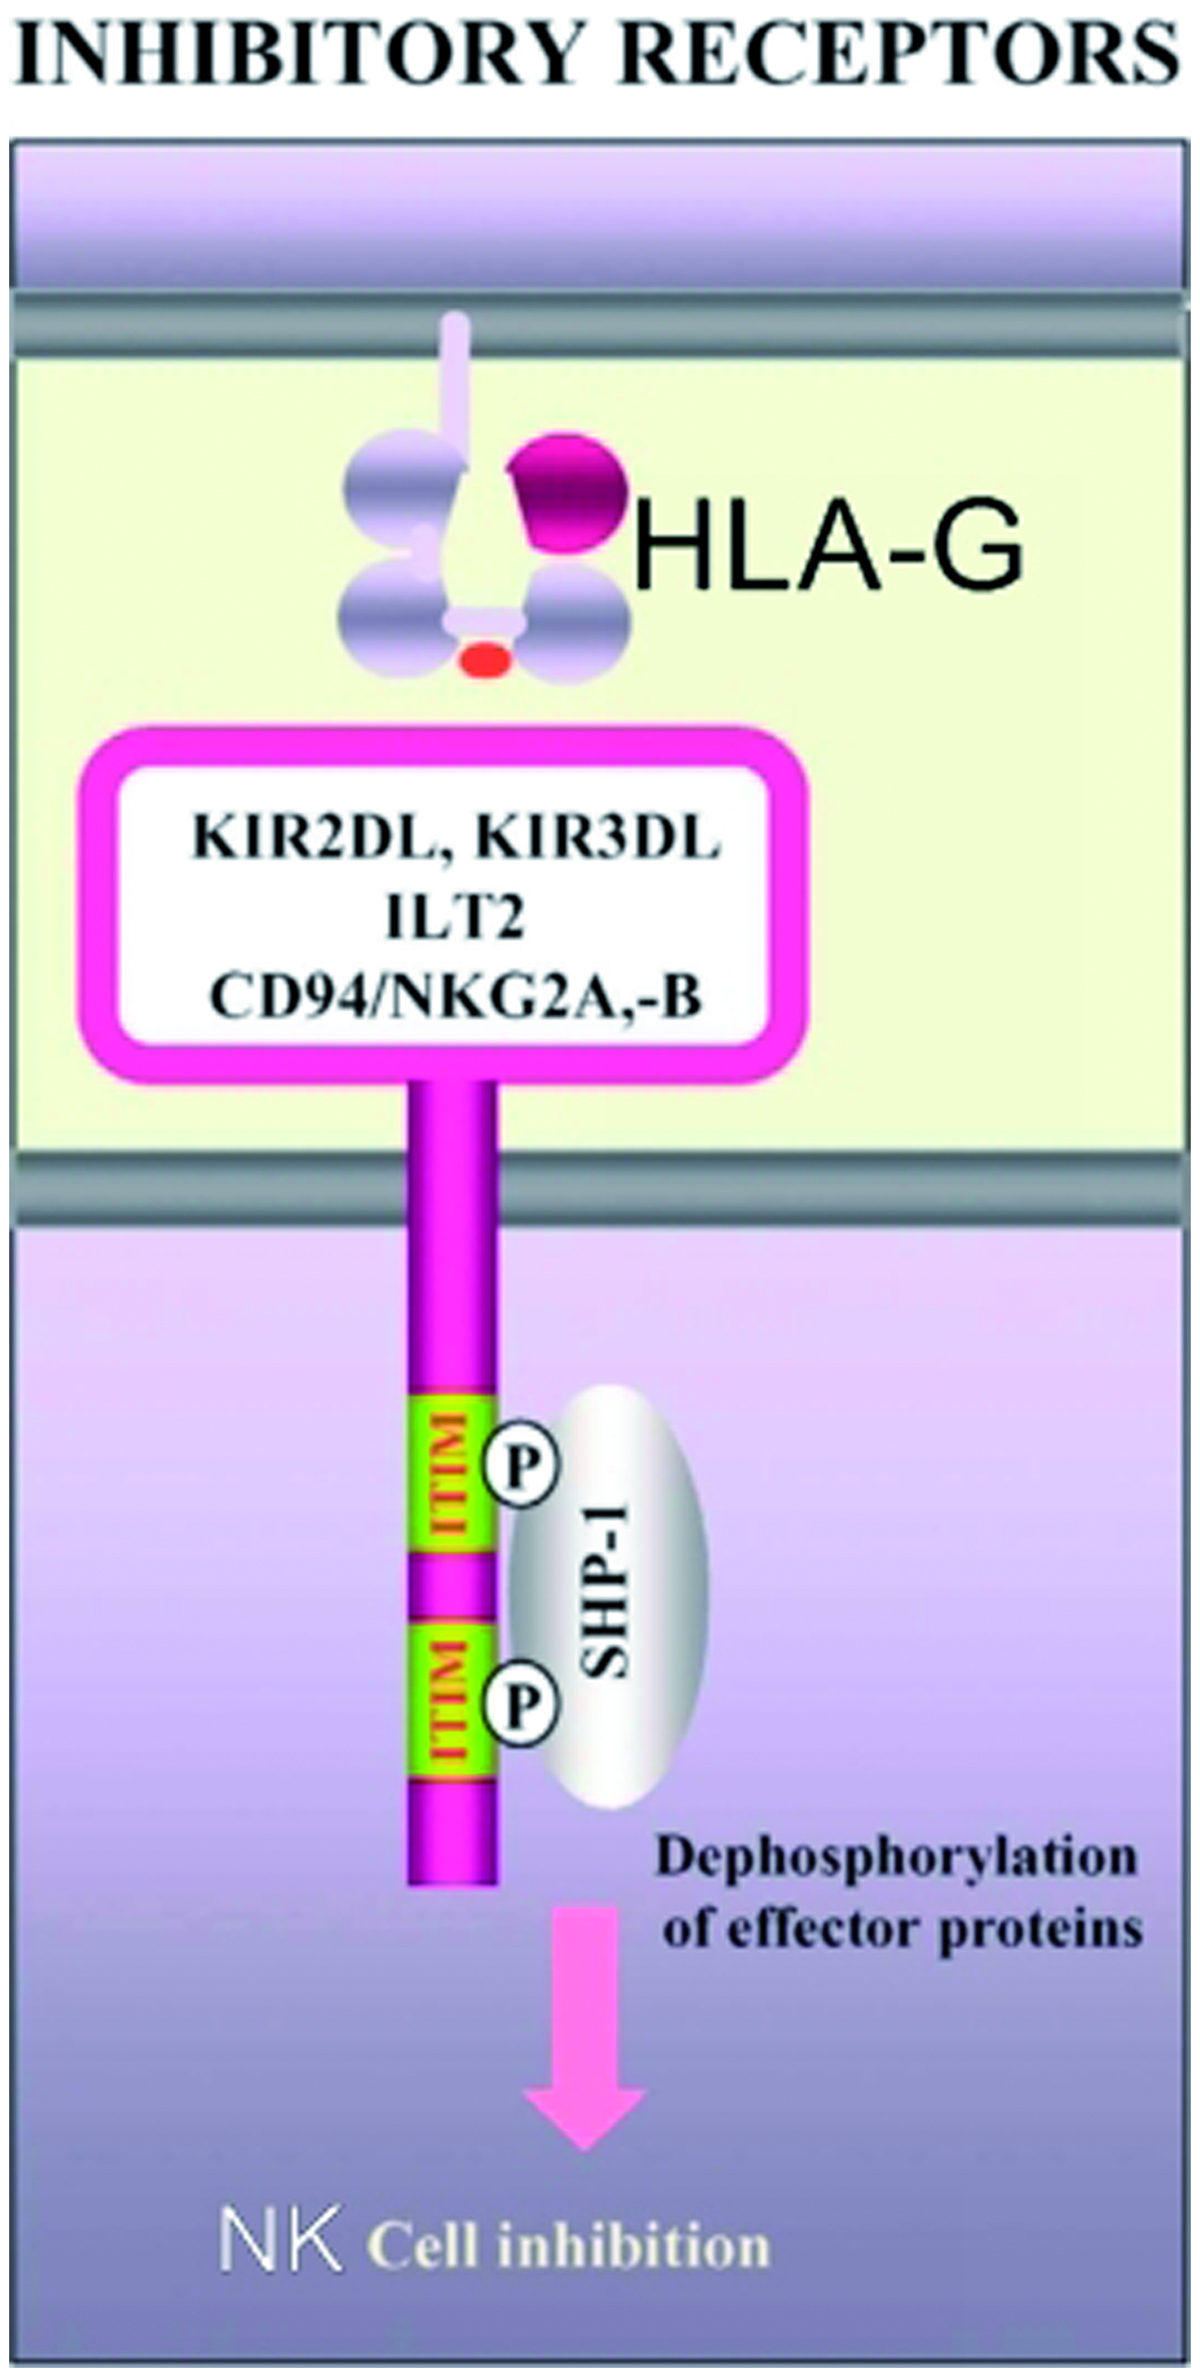
Figure 3. Detection of 14-bp deletion/insertion polymorphisms using electrophoresis. Lane 1: 50-bp ladder; lanes 2 and 5: homozygote for insertion; lanes 3 and 4: heterozygote; lane 6: homozygote for deletion. The figure shows a representative gel. Values to the right indicate the molecular weights of the PCR products (224 or 210 bp) depending on insertion or deletion of the 14 bp in exon 8.
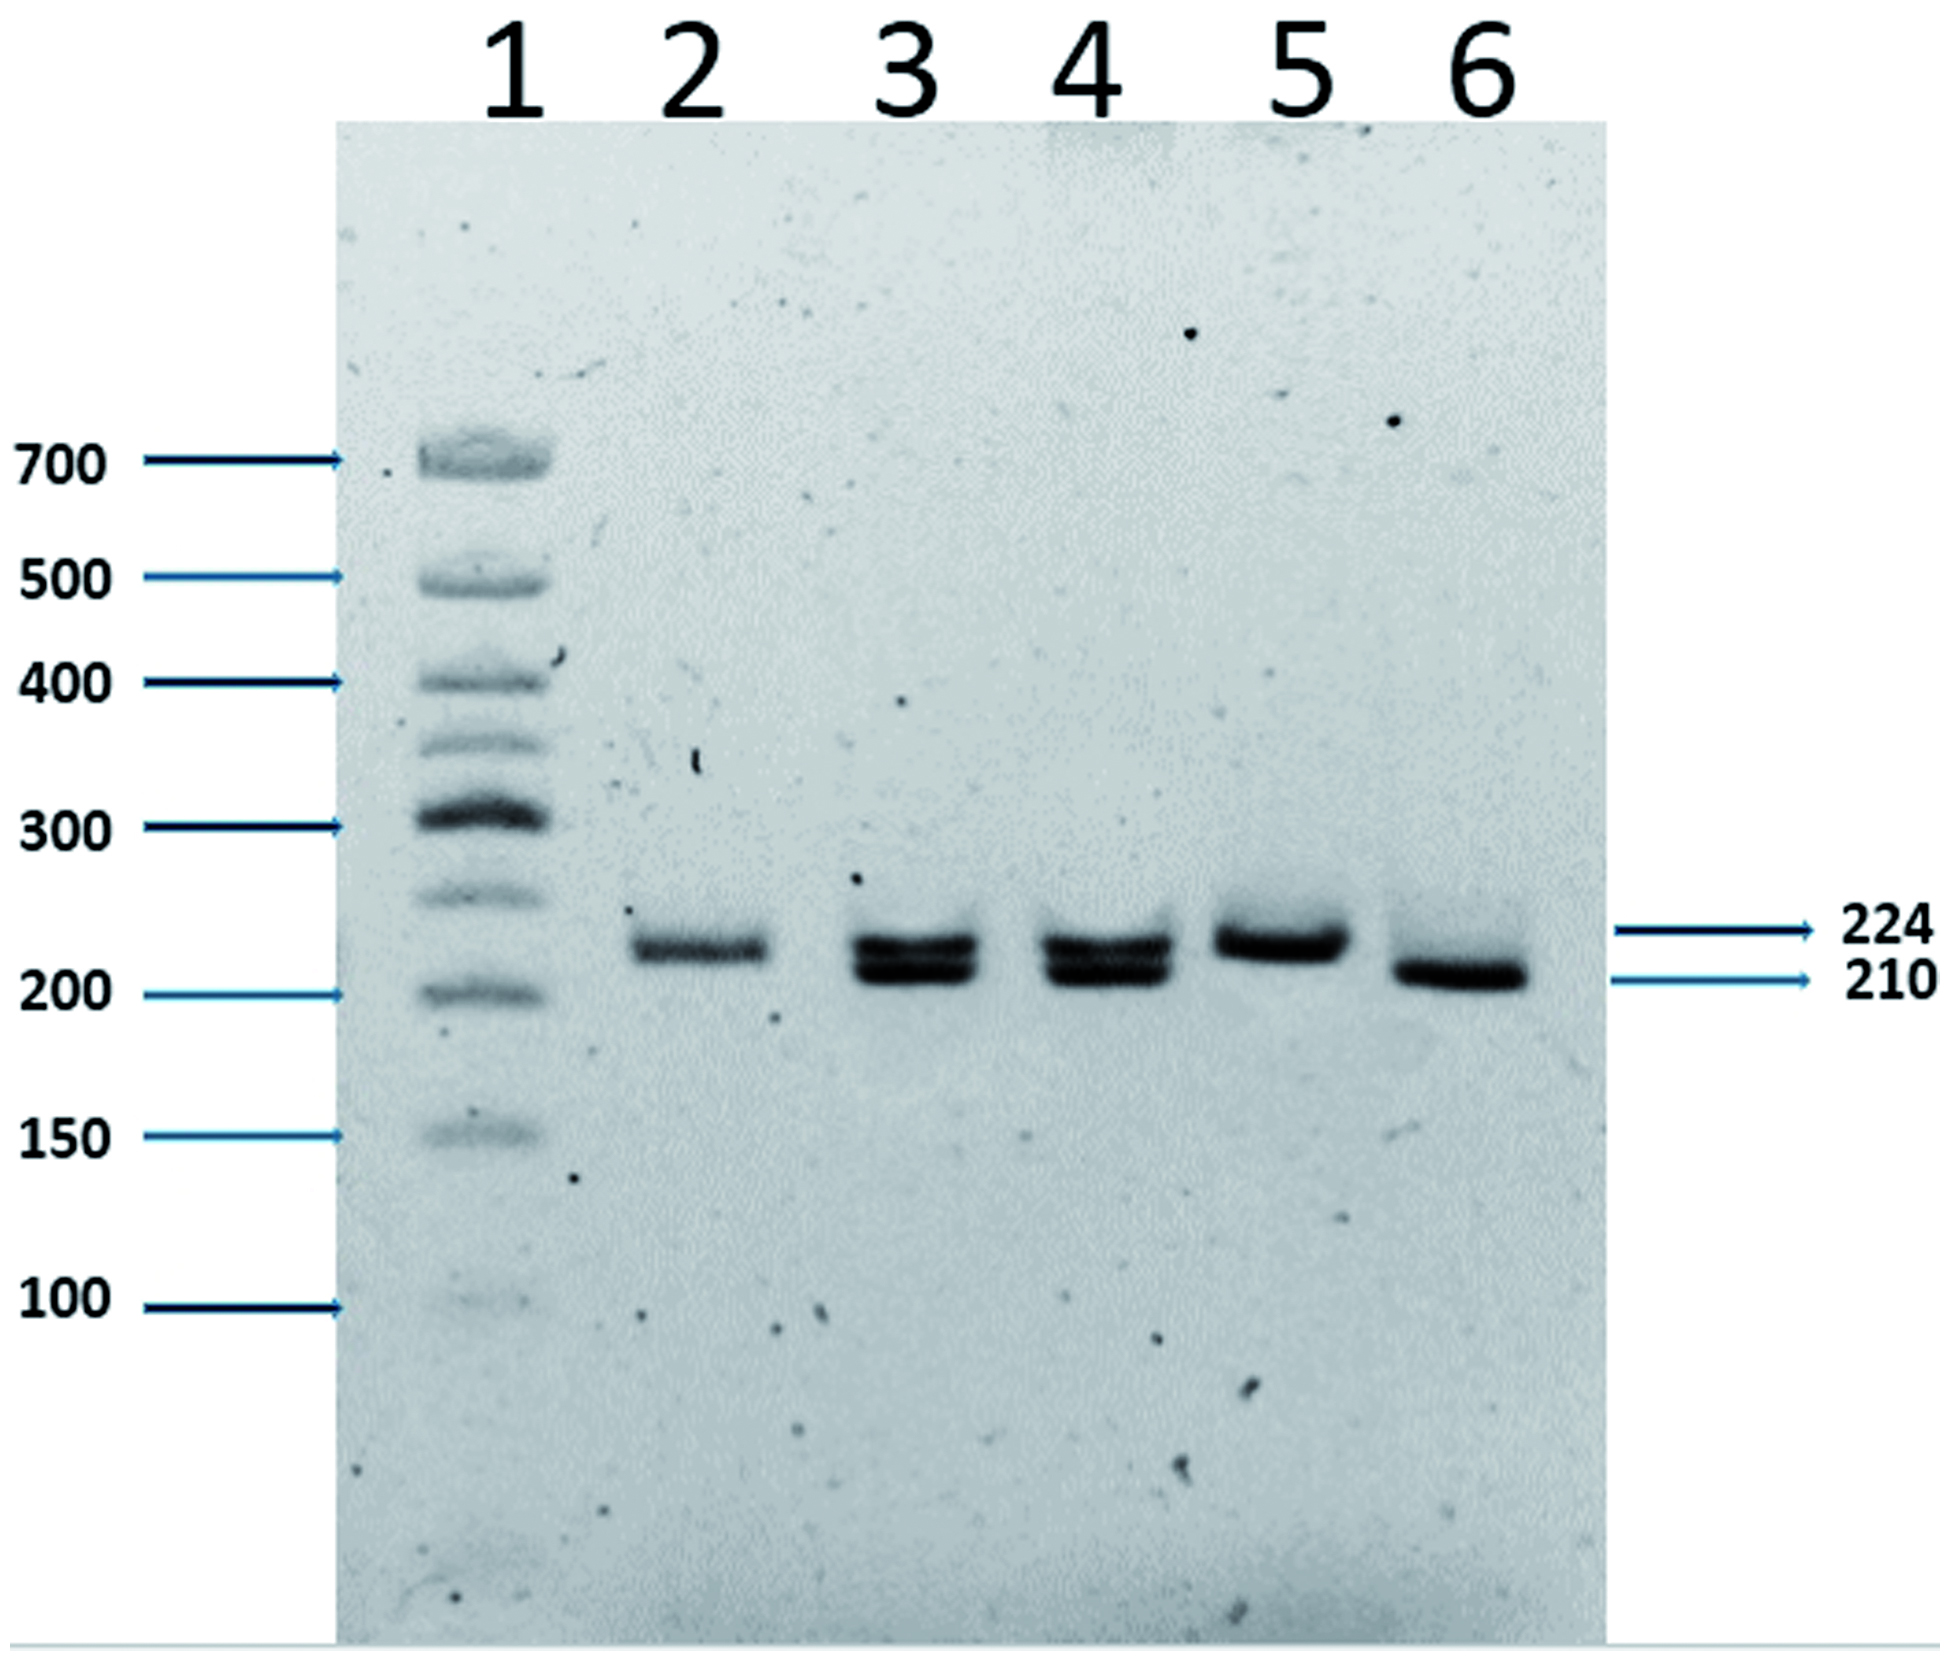
Table 1. Clinical characteristics of patients with RM.
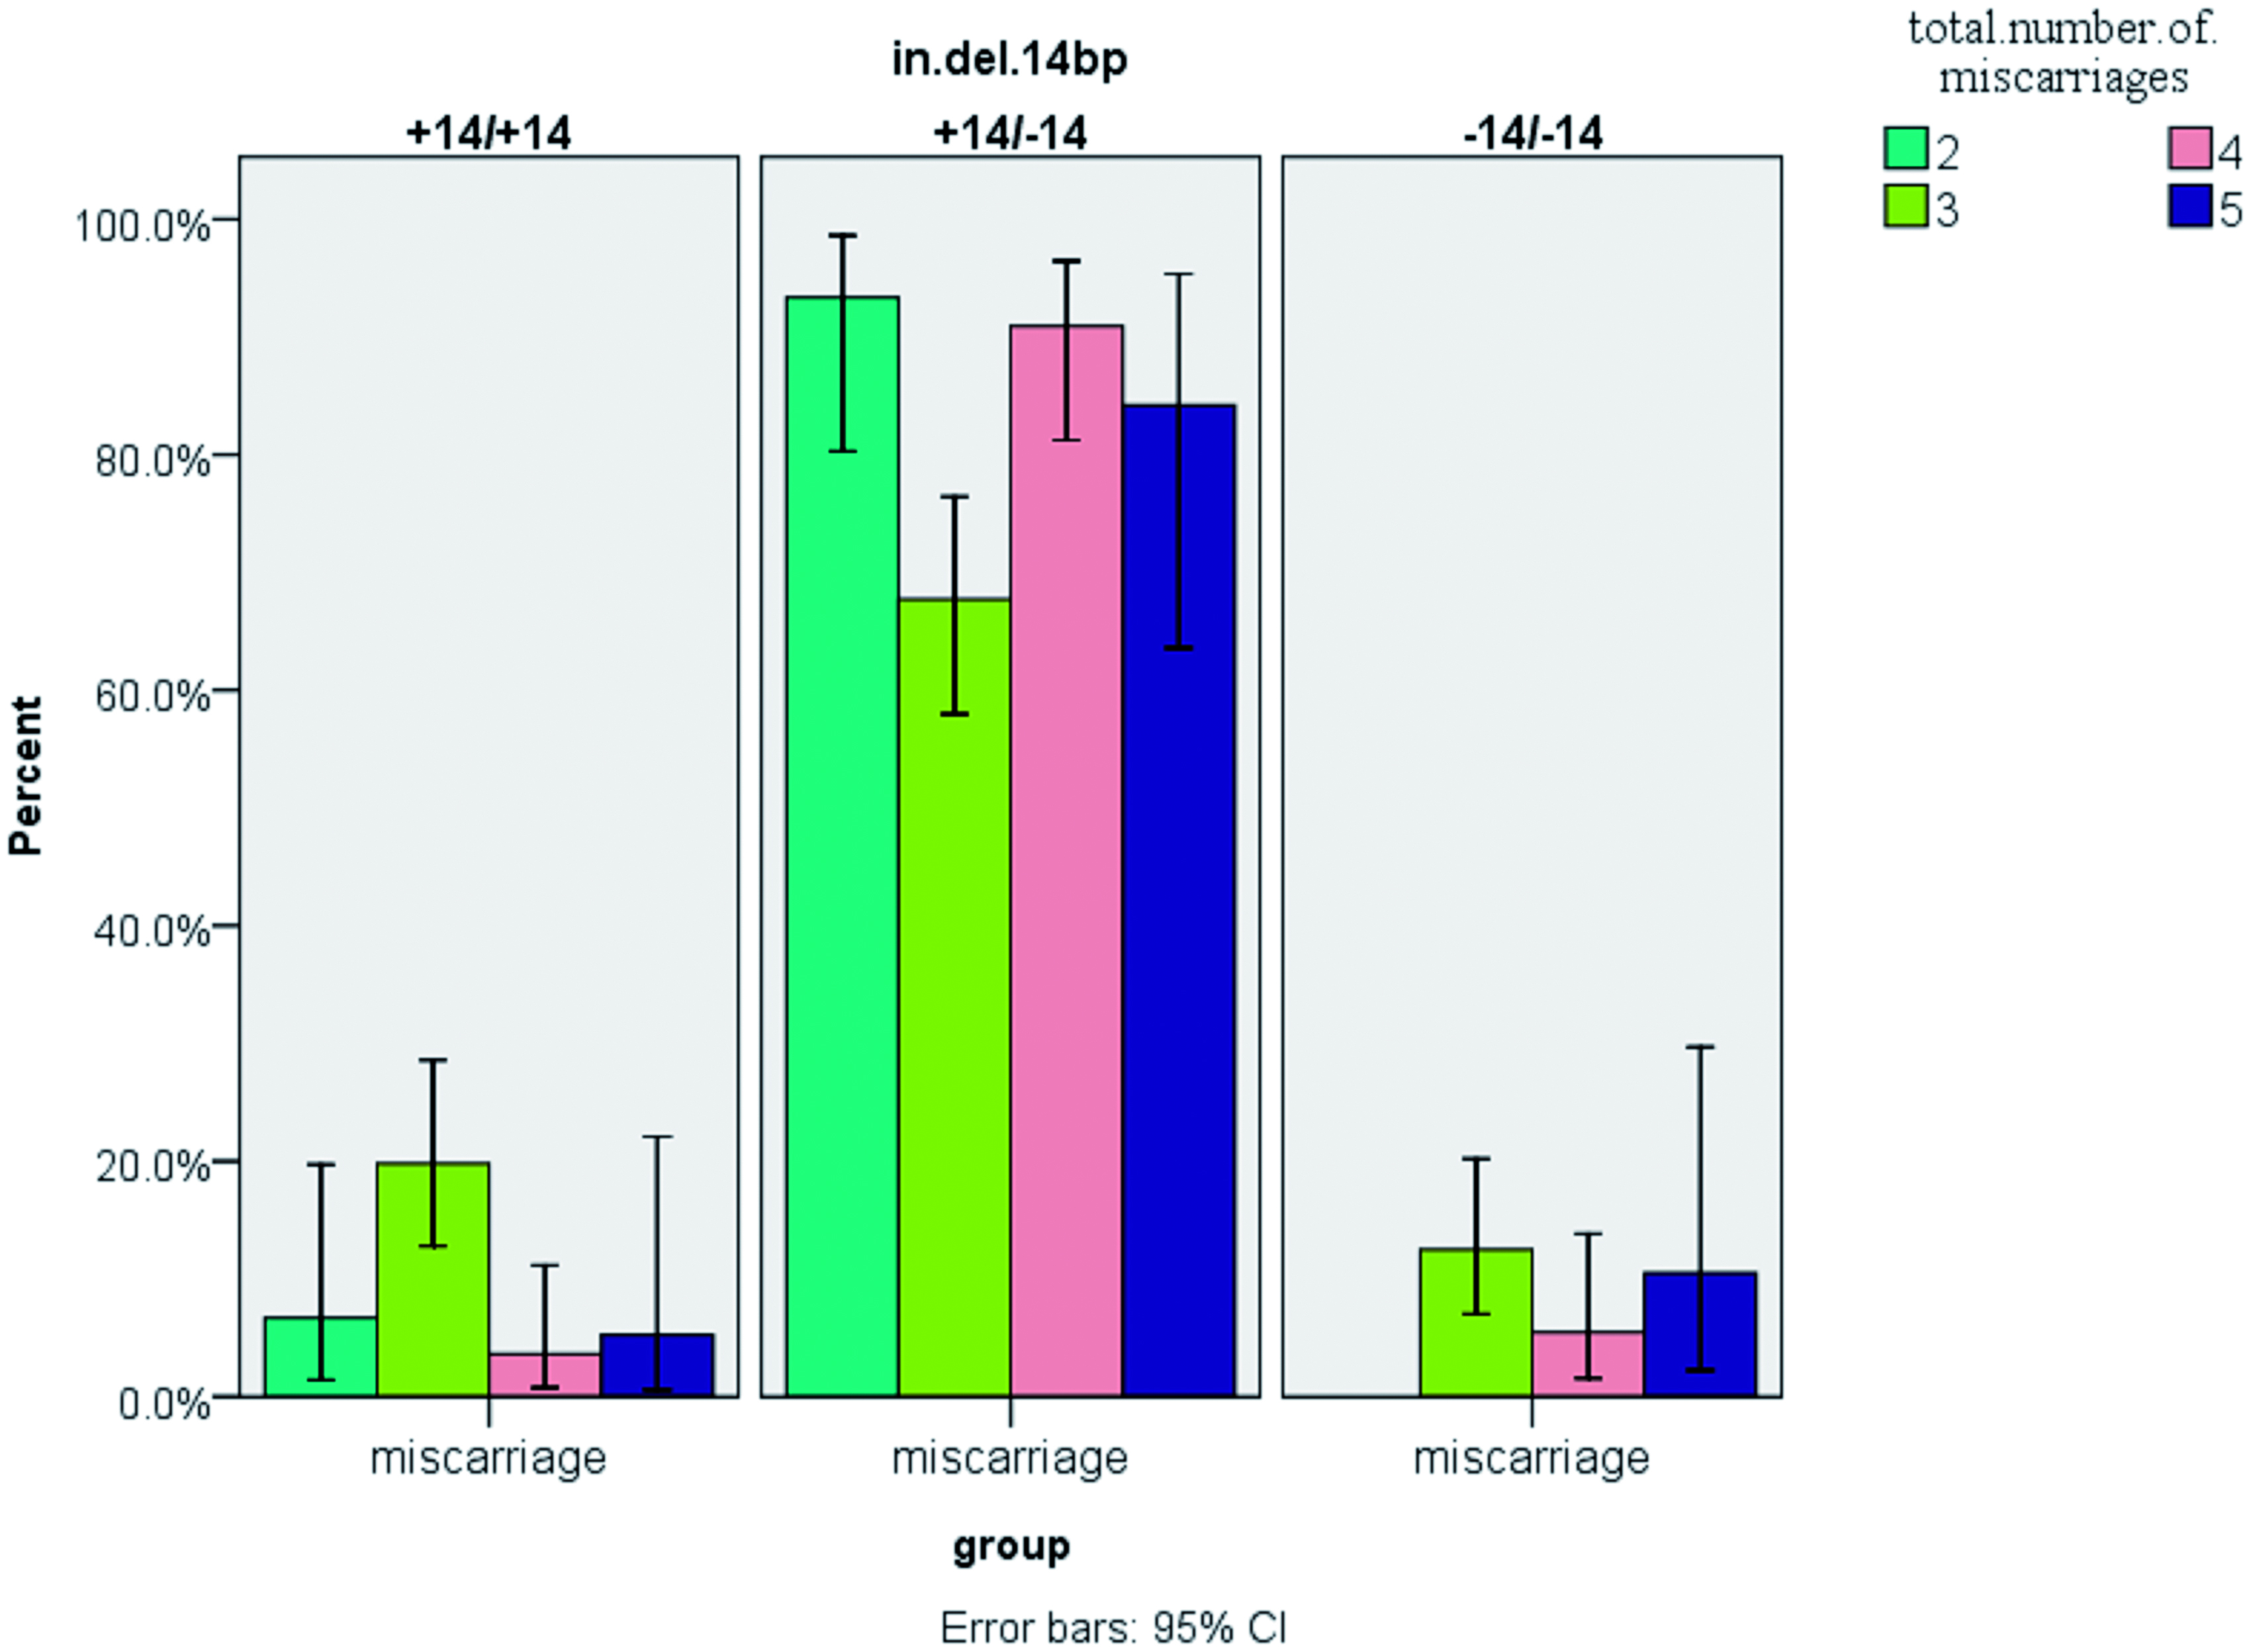
Figure 4. Comparison of genotype frequencies in the context of total miscarriage number. For the three common genotypes, there were significantly more women with the heterozygous genotype that experienced 2–5 miscarriages. Values shown are mean ± SD. At any of the fixed number of miscarriages, all values in the heterozygous group were significantly (p < 0.05) greater than those in either heterozygous group. For n = 200 RM subjects; actual numbers of subjects with 2, 3, 4 or 5 events were, respectively, 30, 96, 55 and 19.