
Figures & data
Figure 1. Purity of isolated CD3+ T cells. Cells isolated using MACS technique were stained with FITC-anti-CD3 and isotype control antibodies. Representative isotype control T cells (left) and isolated T cells (right) are presented.
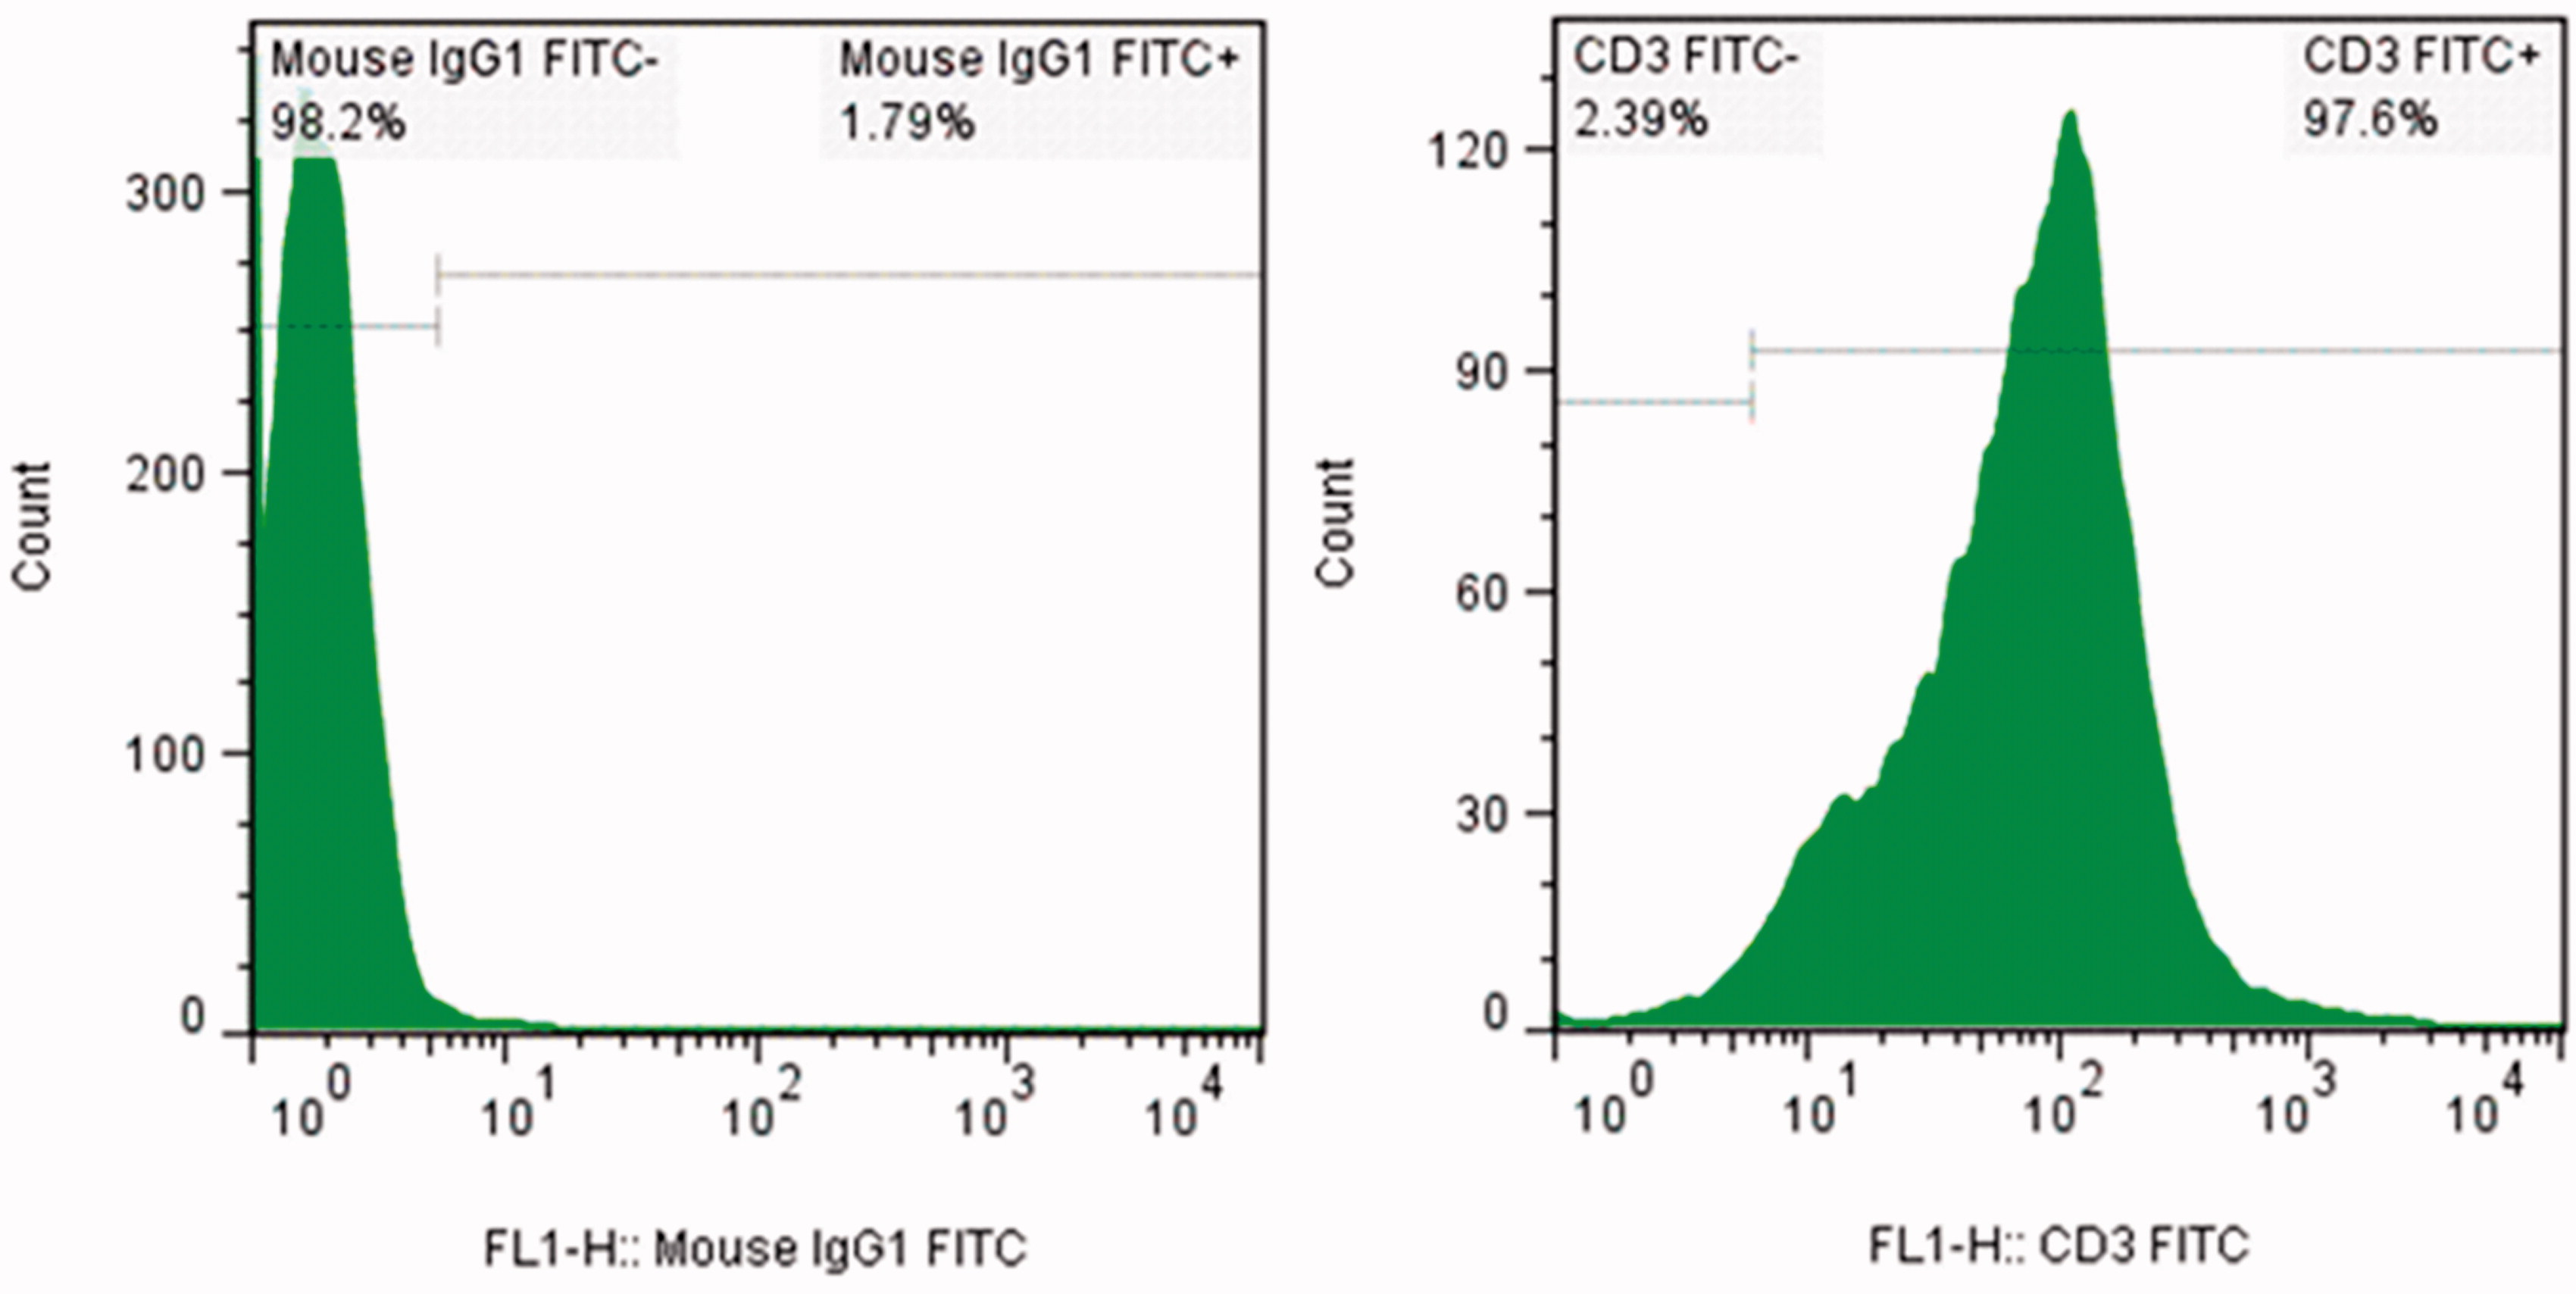
Figure 2. Flow cytometry analysis of T cells treated with rLPG3, NT-LPG3 or CT-LPG3. (A) Purified T cells were incubated with rLPG3, NT-LPG3 or CT-LPG3 for 48 h and then their level of activation examined by flow cytometry. Results shown are mean (± SD) %CD3+CD69+ T cells present. Values significantly different from control are indicated (p < 0.01). (B) Flow cytometric analysis of the T cells is presented in representative dot-blot forms: (a) Whole population of lymphocytes; (b) isotype control; (c) untreated T cells; (d) T cells treated with rLPG3; (e) T cells treated with NT-rLPG3; and (f) T cells treated with CT-rLPG3.
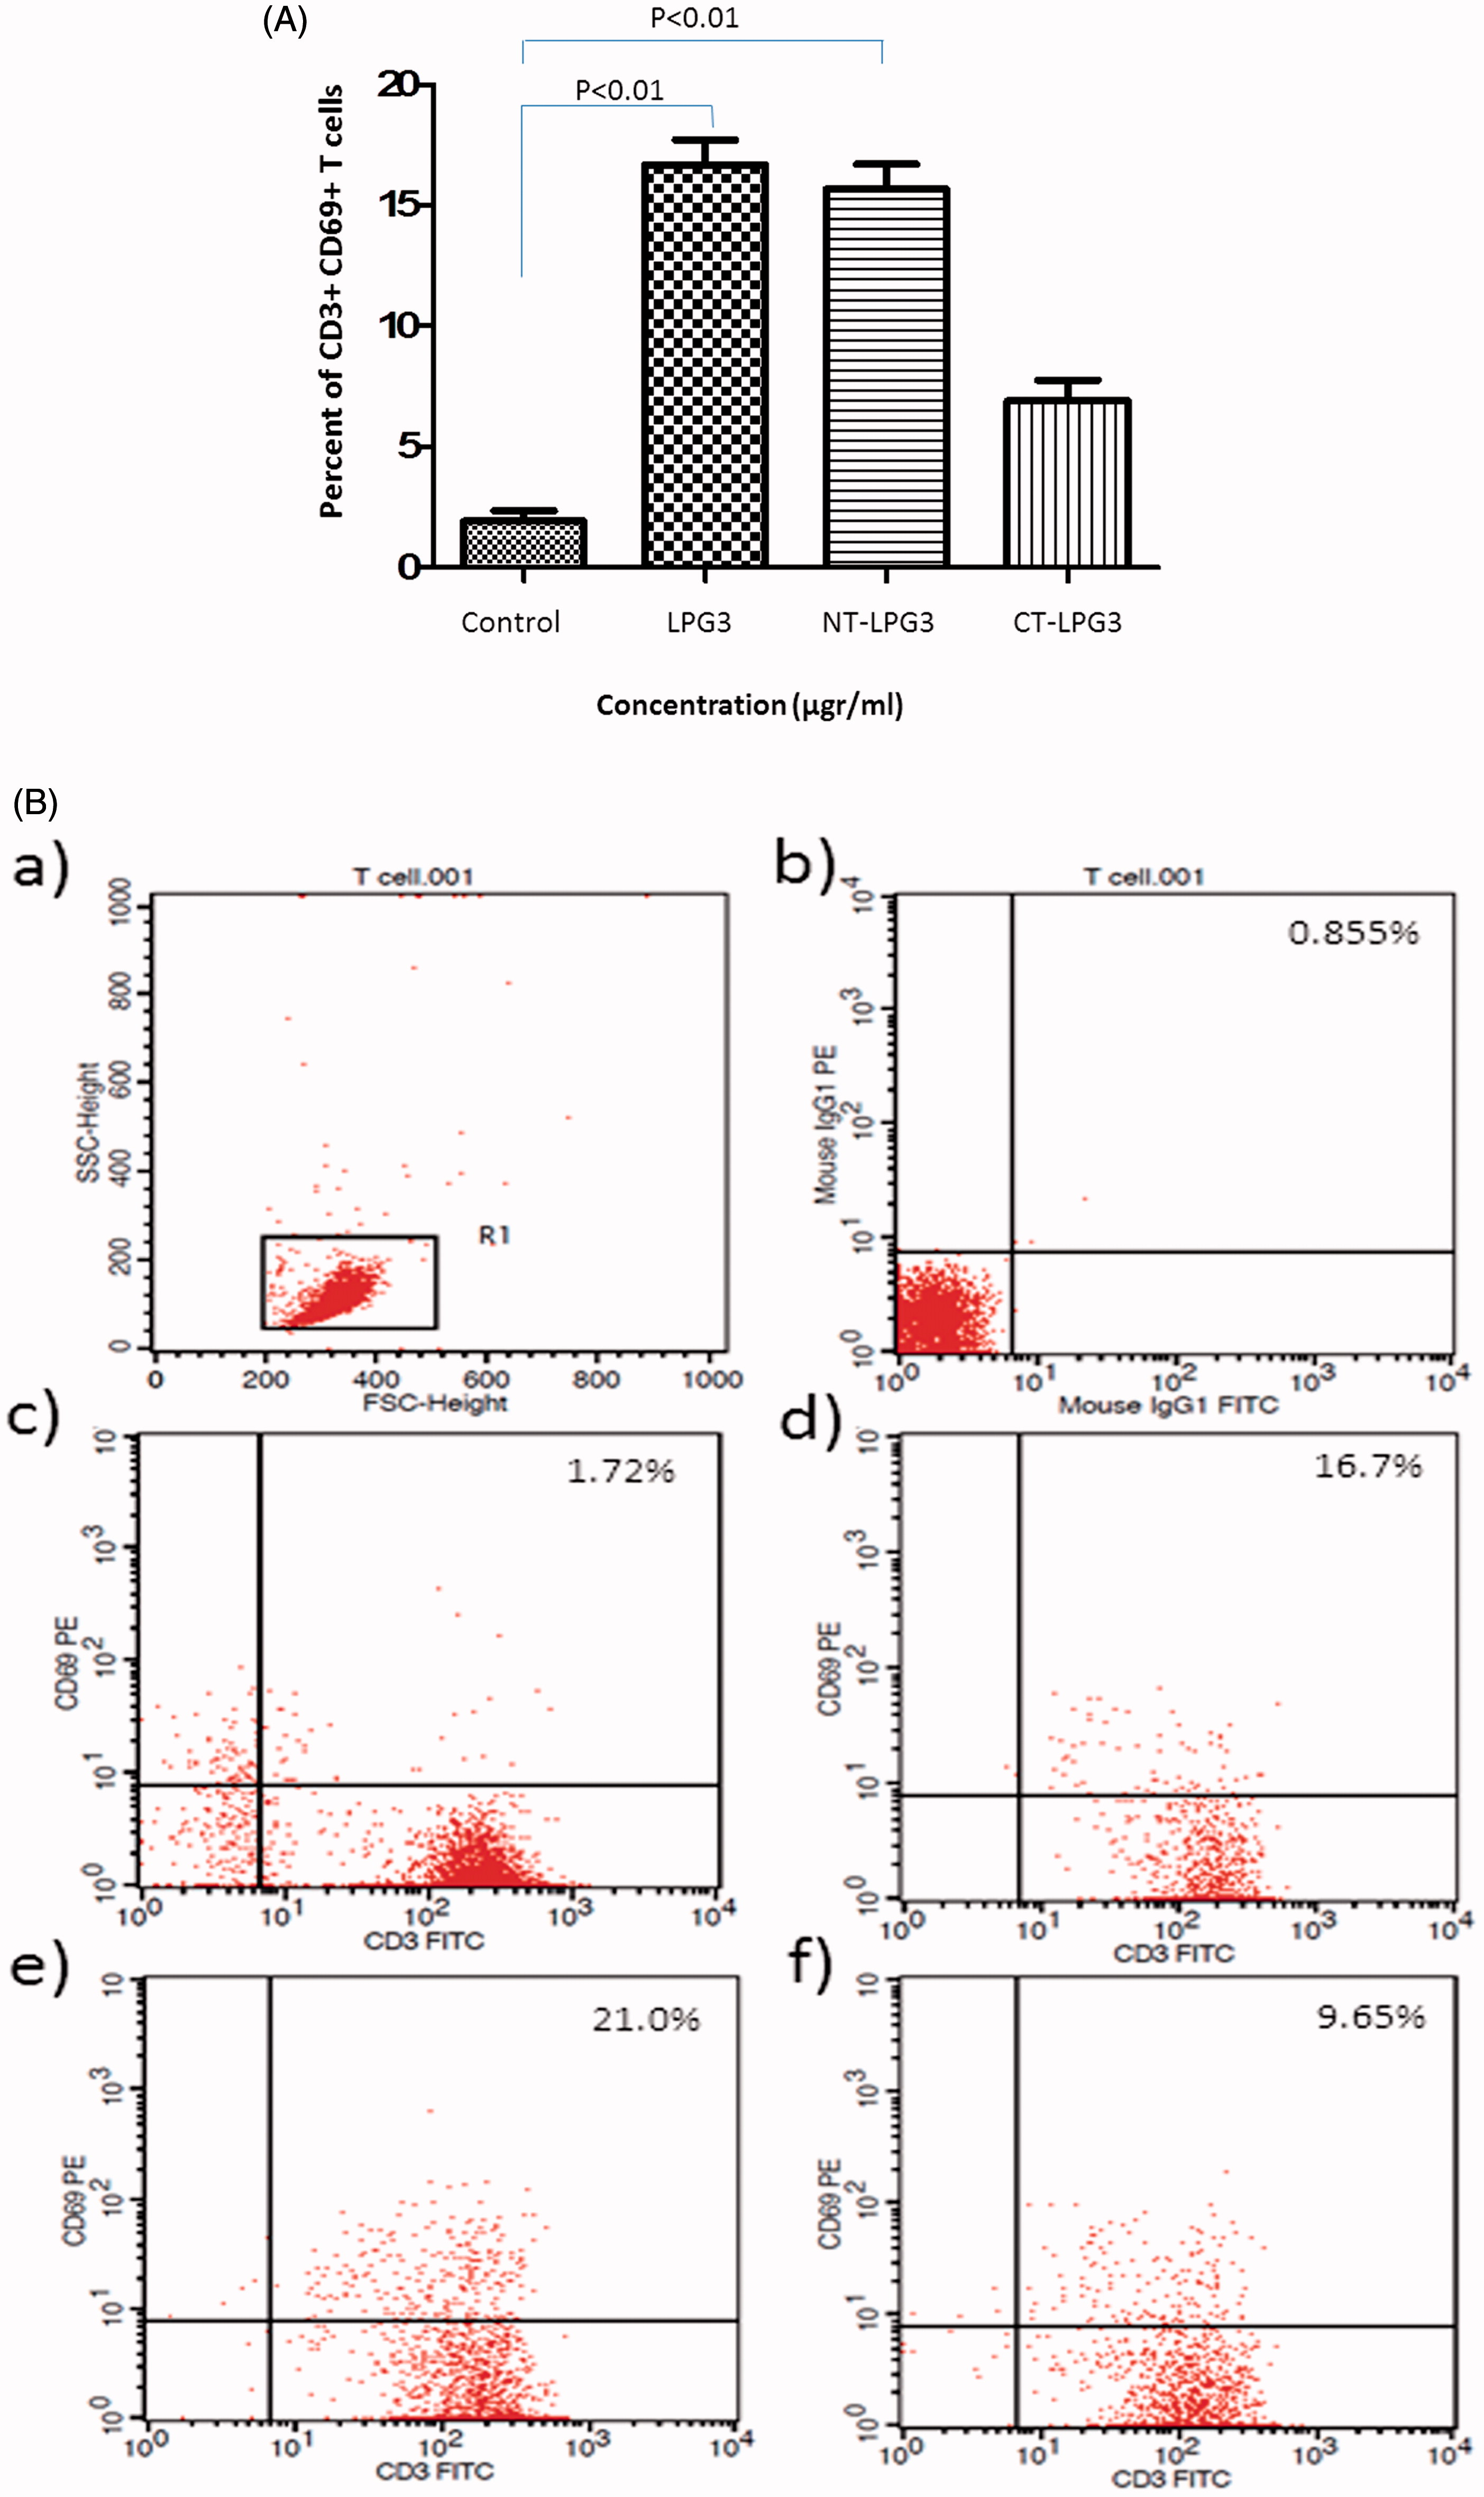
Figure 3. GATA-3 and T-bet mRNA levels. Fold-change in T-bet and GATA-3 mRNA expression in T cells that were stimulated with rLPG3 (2, 10 or 20 μg/ml) for 48 h. Results shown are means [± SD] from 10 samples/treatment. Values significantly different from control are indicated (p < 0.05).
![Figure 3. GATA-3 and T-bet mRNA levels. Fold-change in T-bet and GATA-3 mRNA expression in T cells that were stimulated with rLPG3 (2, 10 or 20 μg/ml) for 48 h. Results shown are means [± SD] from 10 samples/treatment. Values significantly different from control are indicated (p < 0.05).](/cms/asset/8a5a2f7c-0aff-4dc7-a546-4243b2129830/iimt_a_1066906_f0003_c.jpg)
Figure 4. Cytokine secretion by T cells treated with rLPG3, NT-LPG3 or CT-LPG3 for 48 h. Results shown are mean [± SD] amounts of cytokine secreted by cells (in pg/ml) that were treated in the absence or presence of anti-TLR2 antibody; 10 samples/treatment. (A) Secretion of IFNγ by T cells treated with rLPG3, NT-LPG3 or CT-LPG3 for 48 h (p < 0.01). (B) Secretion of IL-4 by T cells treated with rLPG3, NT-LPG3 or CT-LPG3 for 48 h. (C) IFNγ:IL-4 ratio in co-cultured T cells with LPG3, NT-LPG3 or CT-LPG3 following 48 h incubation (p < 0.05). Values significantly different from control are indicated.
![Figure 4. Cytokine secretion by T cells treated with rLPG3, NT-LPG3 or CT-LPG3 for 48 h. Results shown are mean [± SD] amounts of cytokine secreted by cells (in pg/ml) that were treated in the absence or presence of anti-TLR2 antibody; 10 samples/treatment. (A) Secretion of IFNγ by T cells treated with rLPG3, NT-LPG3 or CT-LPG3 for 48 h (p < 0.01). (B) Secretion of IL-4 by T cells treated with rLPG3, NT-LPG3 or CT-LPG3 for 48 h. (C) IFNγ:IL-4 ratio in co-cultured T cells with LPG3, NT-LPG3 or CT-LPG3 following 48 h incubation (p < 0.05). Values significantly different from control are indicated.](/cms/asset/1843026e-d6fa-45a4-a1d9-d72db2a2e869/iimt_a_1066906_f0004_c.jpg)