672
Views
4
CrossRef citations to date
0
Altmetric
Research Article

Renal oxidative stress and renal CD8+ T-cell infiltration in mercuric chloride-induced nephropathy in rats: role of angiotensin II

, , , &
Pages 324-334 | Received 23 Apr 2015, Accepted 31 Aug 2015, Published online: 04 Nov 2015

Figures & data

Figure 1. Losartan or Enalapril effects on renal superoxide anion () production in HgCl2-induced nephropathy. Increased expression of (a) interstitial and (b) tubular in tissues from all HgCl2-treated rats was observed. Losartan and Enalapril treatments diminished only the induced increase in interstitial expression (to levels non-significantly higher than in Group VI control rat tissues: untreated, saline gavaged). In (a) *value is significantly different from those of all other groups of rats shown (p < 0.05). In (b) *of groups shown, value significantly different from that of Group VI control rats only (p < 0.05). Values from rats that received only Losartan- or Enalapril-only were not significantly different from the Group VI rats and so are not presented. Values shown are mean ± SD (n = 10/group). Data analysis was done using a non-parametric ANOVA (Kruskal-Wallis Test) and a Dunn’s multiple comparisons test.
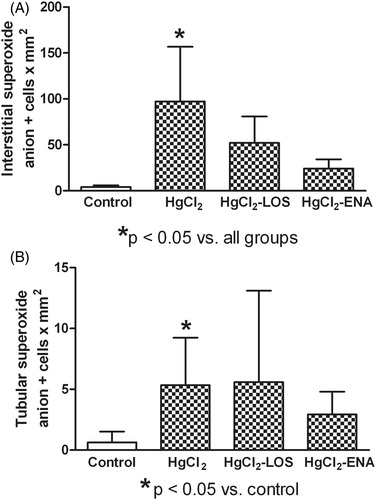
Figure 1. Losartan or Enalapril effects on renal superoxide anion () production in HgCl2-induced nephropathy. Increased expression of (a) interstitial and (b) tubular in tissues from all HgCl2-treated rats was observed. Losartan and Enalapril treatments diminished only the induced increase in interstitial expression (to levels non-significantly higher than in Group VI control rat tissues: untreated, saline gavaged). In (a) *value is significantly different from those of all other groups of rats shown (p < 0.05). In (b) *of groups shown, value significantly different from that of Group VI control rats only (p < 0.05). Values from rats that received only Losartan- or Enalapril-only were not significantly different from the Group VI rats and so are not presented. Values shown are mean ± SD (n = 10/group). Data analysis was done using a non-parametric ANOVA (Kruskal-Wallis Test) and a Dunn’s multiple comparisons test.

Figure 2. Expression of cellular in renal tissues from HgCl2-treated rats. (a) High numbers of -positive cells are seen in tubules (arrows) and interstitium (cross arrow) of HgCl2 only-treated rats. (b) Losartan treatment diminished the number of -positive cells (arrows) relative to that in HgCl2 only-treated rats. Rats in Groups IV, V and VI presented with normal tissues and so micrographs are not shown. Representative micrographs are presented. Original magnification = 400×.
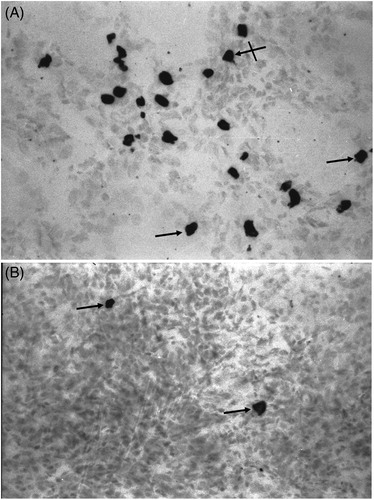
Figure 2. Expression of cellular in renal tissues from HgCl2-treated rats. (a) High numbers of -positive cells are seen in tubules (arrows) and interstitium (cross arrow) of HgCl2 only-treated rats. (b) Losartan treatment diminished the number of -positive cells (arrows) relative to that in HgCl2 only-treated rats. Rats in Groups IV, V and VI presented with normal tissues and so micrographs are not shown. Representative micrographs are presented. Original magnification = 400×.

Figure 3. Effects of Losartan or Enalapril on renal thiobarbituric reactive substance (TBARS) production during HgCl2-induced nephropathy. Increased renal levels of TBARS were found in all HgCl2-treated rats relative to in Group VI (untreated, saline gavaged) control rat tissues. Losartan and Enalapril were not capable of reducing the increase in peroxidation. *Value significantly different from Group VI control rats (p < 0.05). Values from rats that received only Losartan- or Enalapril-only were not significantly different from the Group VI rats and so are not presented. Values shown are mean ± SD (n = 10/group). Data analysis was performed using a non-parametric ANOVA (Kruskal-Wallis Test) and a Dunn’s multiple comparisons test.
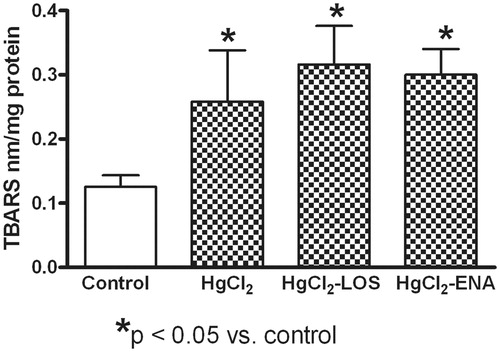
Figure 3. Effects of Losartan or Enalapril on renal thiobarbituric reactive substance (TBARS) production during HgCl2-induced nephropathy. Increased renal levels of TBARS were found in all HgCl2-treated rats relative to in Group VI (untreated, saline gavaged) control rat tissues. Losartan and Enalapril were not capable of reducing the increase in peroxidation. *Value significantly different from Group VI control rats (p < 0.05). Values from rats that received only Losartan- or Enalapril-only were not significantly different from the Group VI rats and so are not presented. Values shown are mean ± SD (n = 10/group). Data analysis was performed using a non-parametric ANOVA (Kruskal-Wallis Test) and a Dunn’s multiple comparisons test.
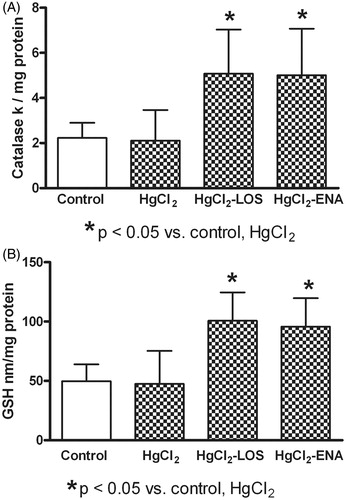
Figure 4. Losartan or Enalapril effects on renal catalase activity and reduced glutathione (GSH) content during HgCl2-induced nephropathy. HgCl2 itself did not modify (a) renal catalase activity or (b) GSH content relative to Group VI control rat tissue values (untreated, saline gavaged). Anti-Ang II treatments significantly increased both parameters in HgCl2-treated hosts. *Value significantly different from Group VI control and from HgCl2-only rats (p < 0.05). Values from rats that received only Losartan- or Enalapril-only were not significantly different from the Group VI rats and so are not presented. Values shown are mean ± SD (n = 10/group). Data analysis was performed using a non-parametric ANOVA (Kruskal-Wallis Test) and a Dunn’s multiple comparisons test.
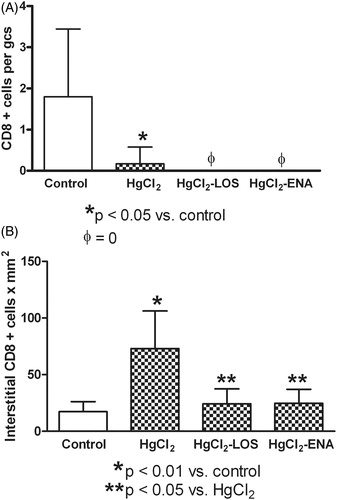
Figure 4. Losartan or Enalapril effects on renal catalase activity and reduced glutathione (GSH) content during HgCl2-induced nephropathy. HgCl2 itself did not modify (a) renal catalase activity or (b) GSH content relative to Group VI control rat tissue values (untreated, saline gavaged). Anti-Ang II treatments significantly increased both parameters in HgCl2-treated hosts. *Value significantly different from Group VI control and from HgCl2-only rats (p < 0.05). Values from rats that received only Losartan- or Enalapril-only were not significantly different from the Group VI rats and so are not presented. Values shown are mean ± SD (n = 10/group). Data analysis was performed using a non-parametric ANOVA (Kruskal-Wallis Test) and a Dunn’s multiple comparisons test.

Figure 5. Losartan or Enalapril effects on renal CD8+ cell infiltration during HgCl2-induced nephropathy. (a) Significantly lower numbers of glomerular CD8+ cells in tissues from all HgCl2-treated rats relative to in Group VI control rat tissues (untreated, saline gavaged) were found. (b) Significantly higher numbers of interstitial CD8+ cells in tissues from HgCl2 only-treated rats relative to levels in Group VI control tissues. At both sites, use of Losartan and Enalapril reduced CD8+ cell levels relative to those in the HgCl2 only rats. *Value significantly different from Group VI control rats (p < 0.05 in (a) and p < 0.01 in (b)). In (a) values from the HgCl2-LOS and HgCl2-ENA rats were significantly different from HgCl2-only and from the control rats (p < 0.05). In (b) **value significantly different from HgCl2-only rats (p < 0.05) only. Values from rats that received only Losartan- or Enalapril-only were not significantly different from the Group VI rats and so are not presented. All values shown are mean ± SD (n = 10/group). Data analysis was performed using a non-parametric ANOVA (Kruskal-Wallis Test) and a Dunn’s multiple comparisons test.

Figure 5. Losartan or Enalapril effects on renal CD8+ cell infiltration during HgCl2-induced nephropathy. (a) Significantly lower numbers of glomerular CD8+ cells in tissues from all HgCl2-treated rats relative to in Group VI control rat tissues (untreated, saline gavaged) were found. (b) Significantly higher numbers of interstitial CD8+ cells in tissues from HgCl2 only-treated rats relative to levels in Group VI control tissues. At both sites, use of Losartan and Enalapril reduced CD8+ cell levels relative to those in the HgCl2 only rats. *Value significantly different from Group VI control rats (p < 0.05 in (a) and p < 0.01 in (b)). In (a) values from the HgCl2-LOS and HgCl2-ENA rats were significantly different from HgCl2-only and from the control rats (p < 0.05). In (b) **value significantly different from HgCl2-only rats (p < 0.05) only. Values from rats that received only Losartan- or Enalapril-only were not significantly different from the Group VI rats and so are not presented. All values shown are mean ± SD (n = 10/group). Data analysis was performed using a non-parametric ANOVA (Kruskal-Wallis Test) and a Dunn’s multiple comparisons test.

Figure 6. Indirect immunofluorescence analysis of renal CD8+ lymphocytes in HgCl2-induced nephropathy. (a) An increased presence of interstitial CD8+ cells (arrows) in tissue from HgCl2 only-treated rats. (b) Co-treatment with Losartan led to a decrease in numbers of these cells (arrows) relative to that in HgCl2 only-treated rats. Rats in Groups IV, V and VI presented with normal tissues and so micrographs are not shown. Representative micrographs are presented. Original magnification = 400×.
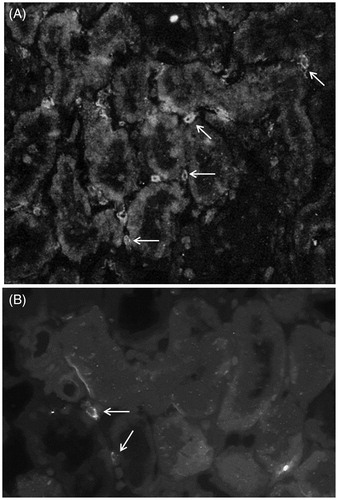
Figure 6. Indirect immunofluorescence analysis of renal CD8+ lymphocytes in HgCl2-induced nephropathy. (a) An increased presence of interstitial CD8+ cells (arrows) in tissue from HgCl2 only-treated rats. (b) Co-treatment with Losartan led to a decrease in numbers of these cells (arrows) relative to that in HgCl2 only-treated rats. Rats in Groups IV, V and VI presented with normal tissues and so micrographs are not shown. Representative micrographs are presented. Original magnification = 400×.

Figure 7. Correlation between renal CD8+ T-cell infiltration and percentage of tubules with necrosis. Significant positive correlation between CD8+ cell infiltration and tubular necrosis was observed. Treatments with (a) Losartan or (b) Enalapril decreased levels of infiltrating cells and tubules with necrosis.
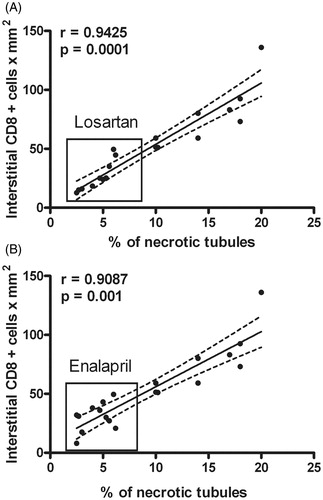
Figure 7. Correlation between renal CD8+ T-cell infiltration and percentage of tubules with necrosis. Significant positive correlation between CD8+ cell infiltration and tubular necrosis was observed. Treatments with (a) Losartan or (b) Enalapril decreased levels of infiltrating cells and tubules with necrosis.

Figure 8. Losartan and Enalapril effects on renal function in HgCl2-induced nephropathy. Serum creatinine levels and urinary protein content remained similar in all HgCl2-treated rats compared to values in Group VI control rats (untreated, saline gavaged). Values from rats that received Losartan or Enalapril only were not significantly different from the Group VI rats and so are not presented. Values shown are mean ± SD (n = 10/group). Data analysis was performed using a non-parametric ANOVA (Kruskal-Wallis Test) and a Dunn’s multiple comparisons test.
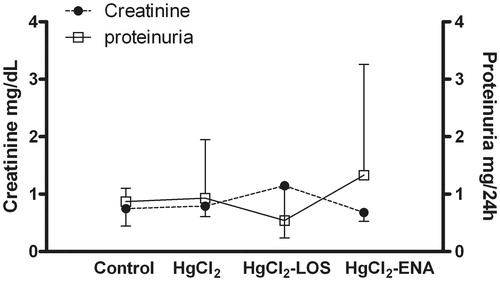
Figure 8. Losartan and Enalapril effects on renal function in HgCl2-induced nephropathy. Serum creatinine levels and urinary protein content remained similar in all HgCl2-treated rats compared to values in Group VI control rats (untreated, saline gavaged). Values from rats that received Losartan or Enalapril only were not significantly different from the Group VI rats and so are not presented. Values shown are mean ± SD (n = 10/group). Data analysis was performed using a non-parametric ANOVA (Kruskal-Wallis Test) and a Dunn’s multiple comparisons test.

Table 1. Values from untreated and Losartan- or Enalapril-treated controls.

Reprints and Corporate Permissions

Please note: Selecting permissions does not provide access to the full text of the article, please see our help page How do I view content?

To request a reprint or corporate permissions for this article, please click on the relevant link below:

Academic Permissions

Please note: Selecting permissions does not provide access to the full text of the article, please see our help page How do I view content?

Obtain permissions instantly via Rightslink by clicking on the button below:

If you are unable to obtain permissions via Rightslink, please complete and submit this Permissions form. For more information, please visit our Permissions help page.