Figures & data
Figure 1. TEM analyses. Analyses of CS samples were performed using a JEOL 2100F transmission electron microscope. (a) Determination of particle size. (b) Size distribution of NP present in the CS sample. Representative analyses are shown.
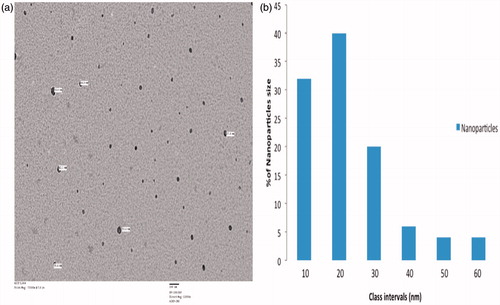
Figure 2. XRD analysis of CS samples. Plotting of the 2-theta values vs signal intensity (in Arbitrary Units [AU]) allowed for identification of the indicated mineral constituents. P = Phillipsite, A = Actinolyte, C = Clinoptilolite, M = Muscovite, D = Dolomite, E = Epidote, Z = Zoisite.
![Figure 2. XRD analysis of CS samples. Plotting of the 2-theta values vs signal intensity (in Arbitrary Units [AU]) allowed for identification of the indicated mineral constituents. P = Phillipsite, A = Actinolyte, C = Clinoptilolite, M = Muscovite, D = Dolomite, E = Epidote, Z = Zoisite.](/cms/asset/26fce36b-116d-4bc8-9074-4eed5c084388/iimt_a_1094152_f0002_b.jpg)
Table 1. Characterization of CS.
Table 2. Humoral immune response-related endpoints.
Table 3. Effects of CS on cell-mediated and innate immunity-related endpoints.
Figure 3. Ex vivo cytokine formation by mouse splenocytes. Splenocytes were isolated from mice in the different test groups and then the cells were plated (2 × 10⁵ cells/well) and then stimulated with ConA (2 μg/ml) or OVA (5 μg/ml) for 72 h. Culture supernatants were then collected and analyzed for the indicated TH1 and TH2 cytokines by ELISA. Values shown are mean ± SE (n = 5). *p< 0.01, #p < 0.05 compared to respective control.
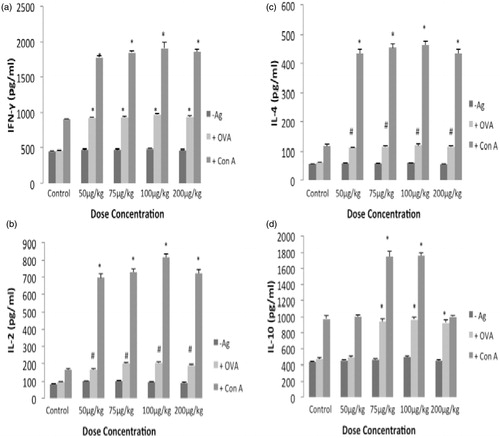
Figure 4. Ex vivo TNFα and IL-1β formation by mouse splenocytes. Splenocytes were isolated from mice in the different test groups and then the cells were plated (2 × 10⁵ cells/well) and then stimulated with ConA (2 μg/ml) or OVA (5 μg/ml) for 72 h. Culture supernatants were then collected and analyzed for the indicated pro-inflammatory cytokines by ELISA. Values shown are mean ± SE (n = 5).
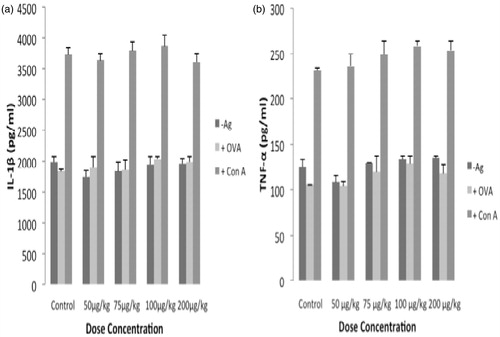
Figure 5. Absorption of CS in rat intestine everted gut sac. Intestinal sacs were incubated in solutions of the indicated CS sample (200 μg/ml) or buffer only for 45 min. Values are expressed as mean ± SE (n = 5). **p < 0.01 compared with control.
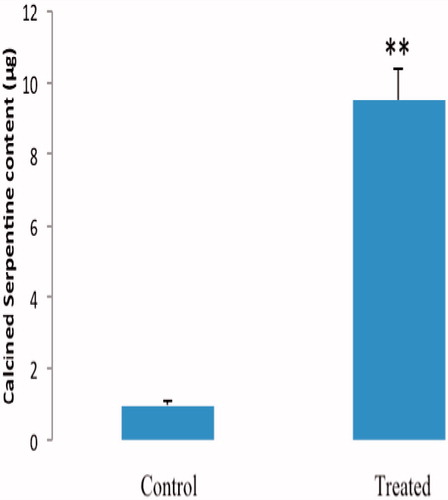
Figure 6. Flow cytometric analysis of peritoneal macrophage TLR-2 and TLR-4 expression. Isolated cells were labeled with AF647-labeled anti-TLR-2 and PE-anti-TLR-4. Representative dot-plots are shown. (a) Control, (b) 50 μg CS/kg, (c) 75 μg CS/kg, (d) 100 μg CS/kg and (e) 200 μg CS/kg dose.
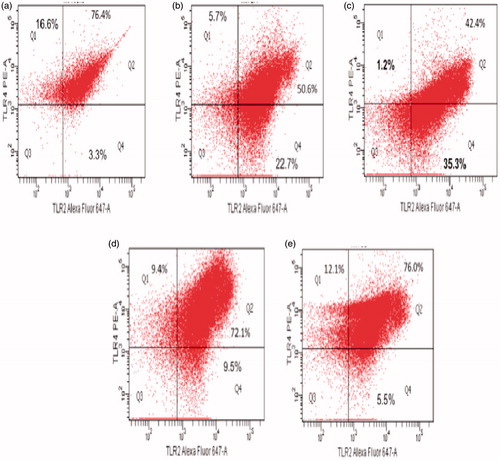
Figure 7. Flow cytometric analysis of peritoneal macrophage co-stimulatory CD80 and CD86 expression. Isolated cells were labeled using FITC anti-CD-80 and PE-anti-CD86. Representative dot-plots are shown. (a) Control, (b) 50 μg CS/kg, (c) 75 μg CS/kg, (d) 100 μg CS/kg, and (e) 200 μg CS/kg dose.
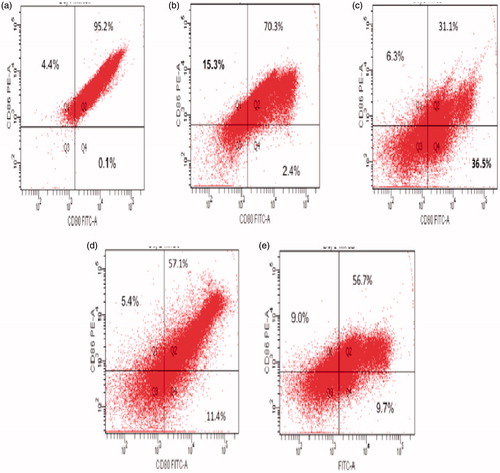
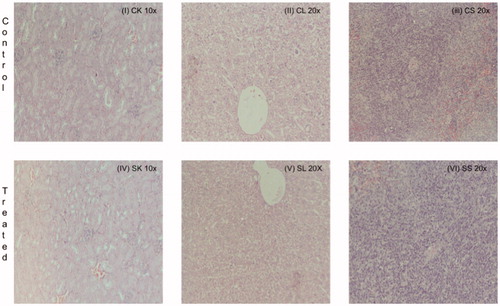
Figure 8. Histopathologic damage due to CS. The mice were daily gavaged with 200 μg CS/kg or vehicle only for 10 days. At 24 h after the final dosing, the host liver, kidney, and spleen were isolated and prepared for histopathology. Representative sections are shown; Magnification = 10–40×. (I) Control mouse kidney, (II) Control mouse liver, (III) Control mouse spleen, (IV) CS mouse kidney, (V) CS mouse liver and (VI) CS mouse spleen.