Figures & data
Figure 1. HPLC chromatogram of (A) reference hyperforin standard with retention time ≈20 min (at 273 nm). (B) The peak in the HPLC chromatogram of St. John’s wort extract was identified by comparing the retention time and UV spectra of hyperforin in the sample with reference standards of hyperforin.
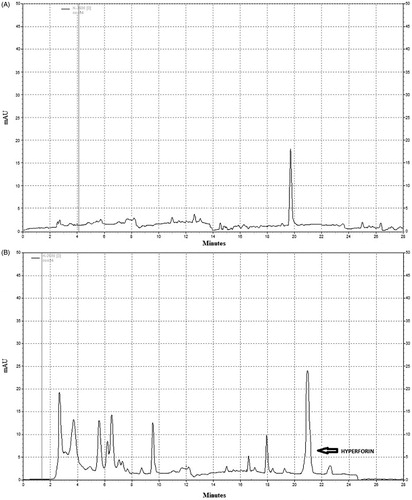
Figure 2. Hyperforin and HPE ameliorate clinical symptoms associated with EAE. Mice were immunized with MOG35–55 peptide (in CFA) and then administered 1, 5 or 10 mg/kg hyperforin (low, intermediate, high doses) or 50, 150 or 300 mg/kg of HPE (low, intermediate, high doses) starting from Day 0 post-immunization onward for 20 days. Mice were monitored for signs of EAE and results presented as (A, B) mean clinical scores, (C, D) incidence of disease and (E, F) mean body weights. Values shown are mean ± SEM; n = 8 (Groups 1, 5, 6, 7) and n = 9 (Groups 2, 3, 4). *p < 0.05, **p < 0.01 vs vehicle control.
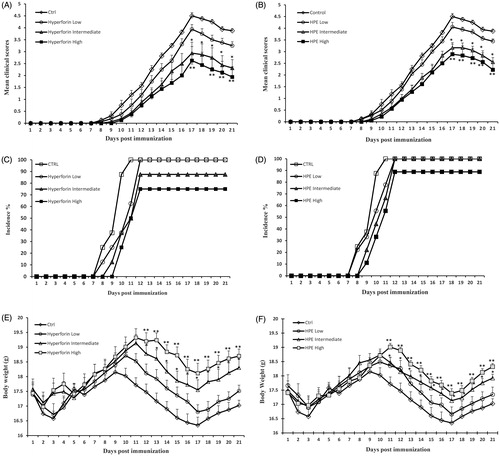
Table 1. Clinical features of EAE and effects of 20-day administration of hyperforin or HPE.
Figure 3. Hyperforin and HPE inhibit ex vivo splenocyte proliferation. EAE mice received (A) hyperforin or (B) HPE at the indicated doses starting at Day 0. On Day 21, mice were euthanized and splenocytes isolated and cultured with MOG35–55 (20 μg/ml) for 72 h. A BrdU cell proliferation assay was used to compare proliferation abilities of the various splenocyte groups. Data are presented as mean ± SEM; n = 8 (Groups 1, 5, 6, 7) and n = 9 (Groups 2, 3, 4) of three independent experiments. *p < 0.05, **p < 0.01, ***p < 0.001 vs vehicle control.
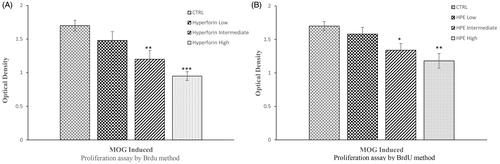
Figure 4. Hyperforin and HPE treatment effects on pathologies associated with EAE. Spinal cords from each mouse (collected on Day 21 post-immunization) were fixed, embedded in paraffin, sections (5-μm) were prepared and the tissues were then stained with (A) H&E to permit enumeration of infiltrating cells and (B) Luxol fast blue to assess the extent of demyelination. (C, D) Histologic features were scored semiquantitatively as described in the Methods section. Values shown are mean ± SEM; n = 8 (Groups 1, 5, 6, 7) and n = 9 (Groups 2, 3, 4). *p < 0.05, **p < 0.01 vs vehicle-treated control.
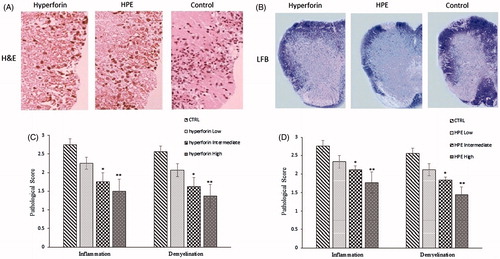
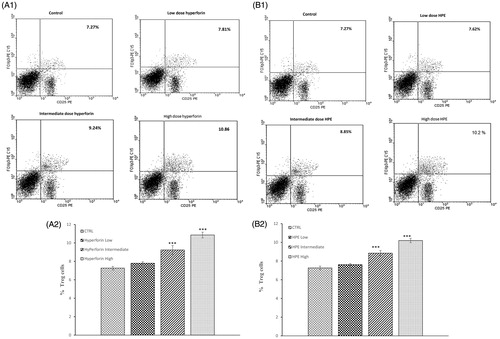
Figure 5. Effects from hyperforin and HPE administration upon T-regulatory (Treg) cell levels. Splenocytes from immunized mice treated with vehicle, Hyperforin (A1 and A2) or HPE (B1 and B2) were isolated at time of sacrifice (Day 21) and analyzed by flow cytometry. Mouse splenocytes were stained with anti-CD4 FITC, anti-CD25 PE, after which the cells were fixed, permeabilized and stained with anti-Foxp3 PE-CY5. Lymphocytes were gated by forward and side-scatter. Lymphocytes were then gated on the CD4+ population and quadrant marker then set on CD25 PE vs isotype control antibody-PE-CY5. Results shown are mean ± SEM; n = 8 (Groups 1, 5, 6, 7) and n = 9 (Groups 2, 3, 4). ***p < 0.001 vs vehicle control. Three independent experiments were performed with similar results.