Figures & data
Figure 1. Effect of ISO on serum levels of TnI. Rats were injected with ISO (250 mg/kg/day, subcutaneous) for 2 days to induce AMI. A significant increase in serum TnI level in ISO treated rats (p < 0.01) from Control rats. Results are expressed as mean (± SD; n = 10 control and 50 ISO).
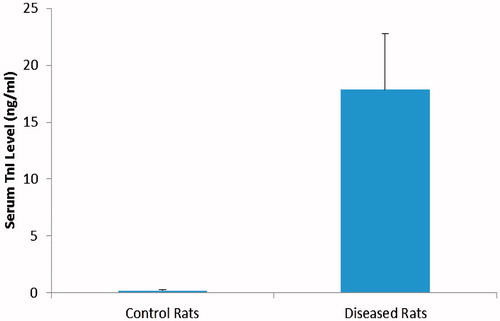
Figure 2. Levels of serum BNP. Rats were injected twice with ISO to induce AMI. Oral PRAV for 4 weeks in combination with BM-MNC significantly decreased the serum BNP level in infarcted rats (p < 0.05). Results are expressed as mean (± SD; n = 10/group). *Value significantly different from Control rats; afrom ISO; bfrom BM-MNC; and cfrom PRAV-treated rats (all p < 0.05).
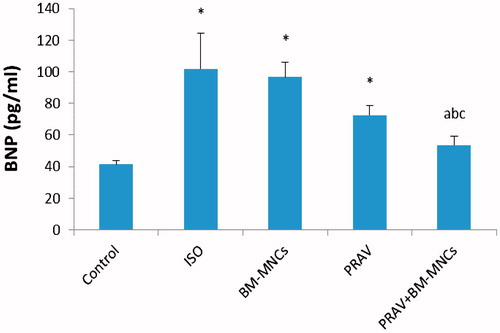
Figure 3. Effect of treatment with oral PRAV, BM-MNC or a combination on levels of MDA, SOD and NO in homogenates of cardiac tissue 4 weeks post-induction of MI in rats. (a–c) Results expressed as mean (± SD; n = 10/group). *Value significantly different from Control rats; afrom ISO; bfrom BM-MNC; and cfrom PRAV-treated rats (all p < 0.05).
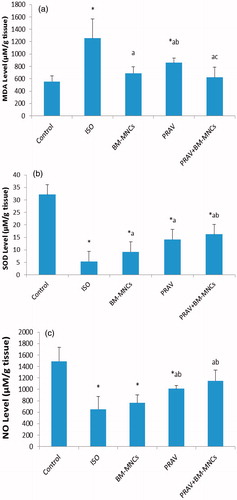
Figure 4. Effect of treatment with oral PRAV, BM-MNC or a combination on levels of TNFα, IL-1β and VEGF in homogenates of cardiac tissue 4 weeks post-induction of MI in rats (a–c). Results expressed as mean (± SD; n = 10/group). *Value significantly different from Control rats; afrom ISO; bfrom BM-MNC; and cfrom PRAV-treated rats (all p < 0.05).
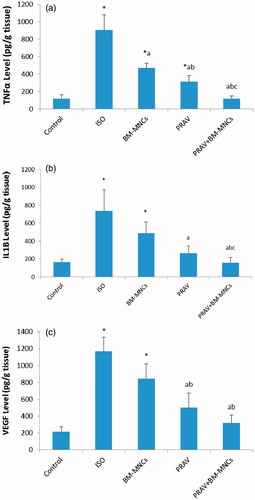
Figure 5. Histology of heart sections recovered from rats. (a) Control rat showing normal myocardial syncytial muscle fibers with normal arrangement, nuclei and vasculature of the heart. (b) ISO only rat showing early infarction, widely-dilated engorged blood vessels with areas of extravasation and inflammatory cells infiltration among apparently normal myocardial syncytial muscle fibers. (c) BM-MNC-treated rat showing infiltration with mononuclear (bone marrow) cells. (d) PRAV-treated rat showing apparently normal myocardial muscle fibers, dilated blood vessels and edematous stroma with minimum inflammatory infiltration. (e) PRAV + BM-MNC-treated rat showing bone marrow cells in edematous myocardial stroma with minimal inflammatory infiltration (as compared to the ISO only rats). H&E stain. Magnification = 400×. Representative sections are shown.
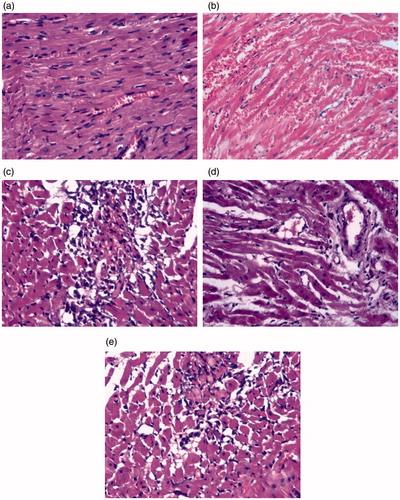
Figure 6. Caspase-3 DAPI staining for apoptotic cells in heart tissues. (a) Section from Control rat showing positive staining for caspase 3. (b) ISO only rat tissue showing focal deeply-stained muscle fibers (heavily positive) for caspase 3; extravasated blood appears at periphery of section. (c) BM-MNC-treated; (d) PRAV-treated; and (e) PRAV + BM-MNC-treated rat tissue.
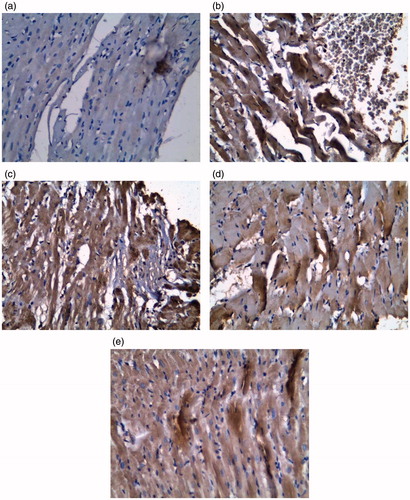
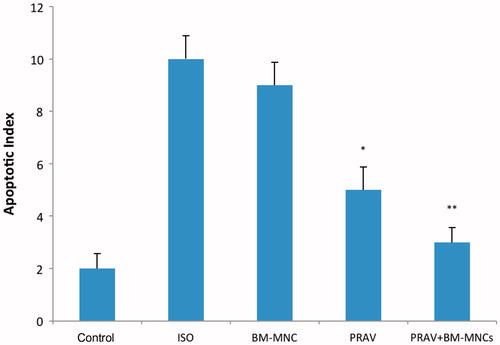
Figure 7. Apoptotic indices. Results are expressed as mean ± SEM (n = 10/group). Quantification shows that apoptotic myocytes were significantly reduced in the PRAV group vs ISO only group (*p < 0.05) and in the PRAV + BM-MNC group vs ISO only group (**p < 0.01). There was no significant difference between PRAV and PRAV + BM-MNC group outcomes.