Figures & data
Table 1. Amplification and pyrosequencing primer sets.
Figure 1. TNFα expression (mean ± standard deviation) of cells treated with 100 μM BeSO4, 100 μM CoCl2, 100 μM Ni(II)Cl2, 100 μM Al2(SO4)3, 100 μl phosphate-buffered saline (PBS, pH 7.4) or non-addition control (NC); n = 3 experiments. H36.12J cells treated with Be expressed 446.90 [± 110.98] pg TNFα/ml, significantly more than produced by H36.12J cells treated with either Al2(SO4)3 239.78 [± 10.85] pg TNFα/ml, Ni(II)Cl2 170.38 [± 19.12] pg TNFα/ml, PBS 122.41 [± 23.23] pg TNFα/ml or NC 152.95 [± 22.01] pg TNFα/ml (p < 0.01). This amount of TNFα was also significantly greater than amounts made by either the H36.12E or P388D.1 cells (p < 0.03) treated with Be.
![Figure 1. TNFα expression (mean ± standard deviation) of cells treated with 100 μM BeSO4, 100 μM CoCl2, 100 μM Ni(II)Cl2, 100 μM Al2(SO4)3, 100 μl phosphate-buffered saline (PBS, pH 7.4) or non-addition control (NC); n = 3 experiments. H36.12J cells treated with Be expressed 446.90 [± 110.98] pg TNFα/ml, significantly more than produced by H36.12J cells treated with either Al2(SO4)3 239.78 [± 10.85] pg TNFα/ml, Ni(II)Cl2 170.38 [± 19.12] pg TNFα/ml, PBS 122.41 [± 23.23] pg TNFα/ml or NC 152.95 [± 22.01] pg TNFα/ml (p < 0.01). This amount of TNFα was also significantly greater than amounts made by either the H36.12E or P388D.1 cells (p < 0.03) treated with Be.](/cms/asset/5eda1f89-0c8c-467a-8fdb-9dc0655c5fbd/iimt_a_1115447_f0001_c.jpg)
Figure 2. Representative CpG methylation for TNFα (a) and IFNγ (b) (mean ± standard deviation) of cells treated with 100 μM BeSO4, 100 μM CoCl2, 100 μM Ni(II)Cl2, 100 μM Al2(SO4)3, 100 μl phosphate-buffered saline (PBS, pH 7.4) or a non-addition control (NC); n = 3 experiments. (a) Percentage methylation of TNF1-1 CpG by treatment for each of the three cell types is representative of CpG methylation seen at this site within TNFα promoter region. (b) Percentage methylation observed for the three cell types (by treatment) for the IFN1-1 CpG site is representative of methylation levels observed in the IFNγ promoter region.
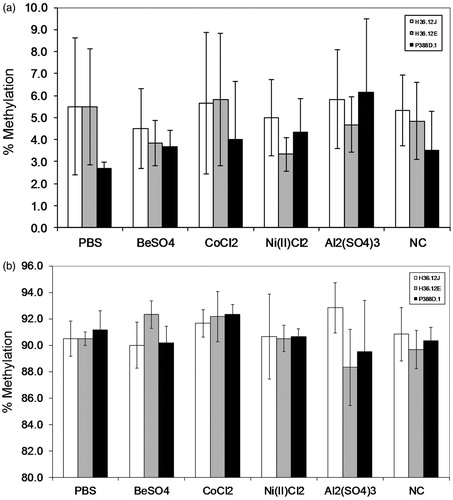
Table 2. Percentage CpG methylation.
Figure 3. H36.12J percentage TNFα promoter CpG methylation (mean ± standard deviation) of cells treated with 100 μM BeSO4, 100 μM CoCl2, 100 μM Ni(II)Cl2, 100 μM Al2(SO4)3, 100 μl phosphate-buffered saline (PBS, pH 7.4) or a non-addition control (NC); n = 3 experiments. Percentage methylation observed with each treatment at each of the six TNFα promoter CpG sites investigated showed no significant difference between treatments.
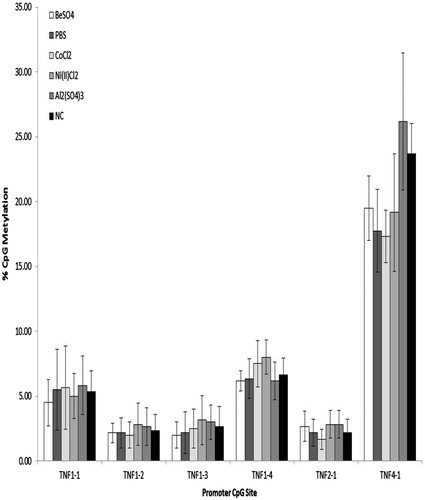
Figure 4. Percentage TNFα promoter CpG methylation (mean ± standard deviation) of cells treated with 100 μM BeSO4, 100 μM CoCl2, 100 μM Ni(II)Cl2, 100 μM Al2(SO4)3, 100 μl phosphate-buffered saline (PBS, pH 7.4) or a non-addition control (NC); n = 3 experiments. Comparing the levels of CpG promoter methylation between the three mouse cell lines cultured with 100 μM BeSO4 overnight revealed significantly less (p < 0.005) methylation at CpG site TNF 4-1 in H36.12J cells when compared to in P388D.1 cells, the parental cell line.
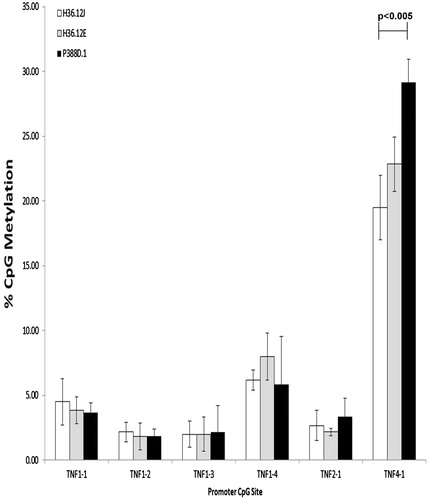
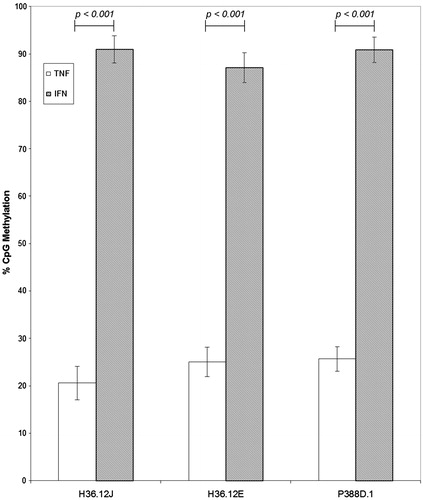
Figure 5. Comparisons of TNFα and IFNγ CpG percentage methylation (mean ± standard deviation) of cells treated with 100 μM BeSO4, 100 μM CoCl2, 100 μM Ni(II)Cl2, 100 μM Al2(SO4)3, 100 μl phosphate-buffered saline (PBS, pH 7.4) or non-addition control (NC); n = 3 experiments. Comparison of overall percentage CpG methylation for each promoter region separated by cell type, regardless of cell treatment, shows percentage CpG methylation of the TNFα promoter was much lower than that of the IFNγ promoter within each cell type.