Figures & data
Figure 1. Treatment protocols. Details are provided in the Methods section.
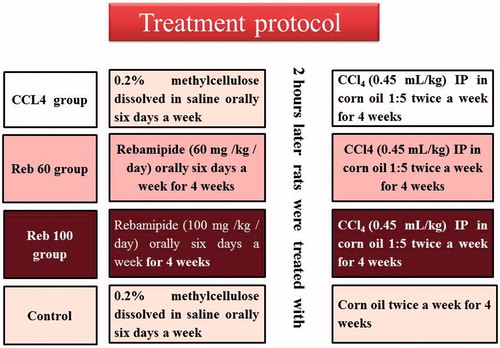
Figure 2. Effect of rebamipide on plasma ALT, AST and bilirubin. (A) ALT; (B) AST; (C) Bilirubin. Values shown are means ± SD (n = 10/group). Value significantly different compared to acontrol rats or bCCl4 only-treated rats (p < 0.05).
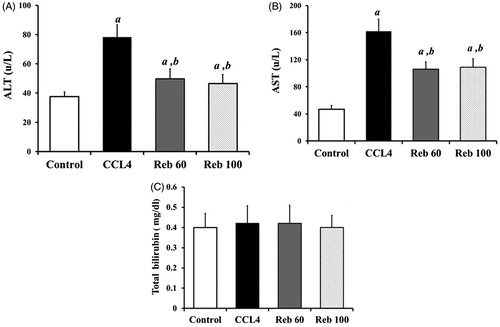
Figure 3. Effect of rebamipide on hepatic oxidative stress (MDA and SOD). (A) MDA (in nmol/g liver protein). (B) SOD (in U/g liver protein). Values shown are means ± SD (n = 10/group). Value significantly different compared to a control rats or b CCl4 only-treated rats (p < 0.01).
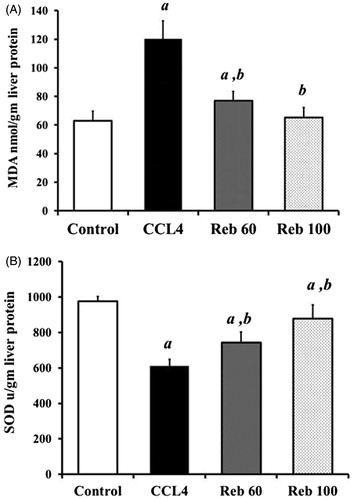
Figure 4. Effect of rebamipide on fibrotic markers (hyalouronic acid, pro-collagen-III and transforming growth factor-β1). (A) Hyalouronic acid (HA, in pg/g liver protein). (B) Pro-collagen-III (Procol-III, in pg/g liver protein). (C) Transforming growth factor (TGF)-β1 (in ng/g liver protein). Values shown are means ± SD (n = 10/group). Value significantly different compared to acontrol rats or bCCl4 only-treated rats (p < 0.01).
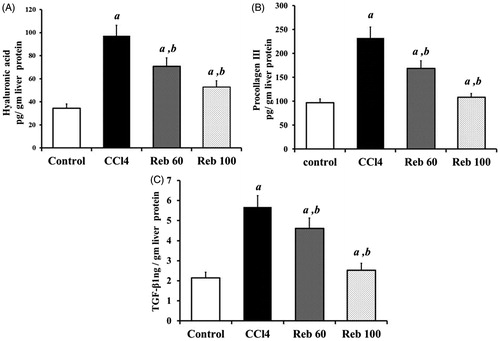
Figure 5. Histology of liver. Organs were recovered at necropsy and then processed and stained with hematoxylin and eosin. (A) Control rats showed normal histological structure of the portal area and surrounding hepatocyte. (B–D) Rats treated with CCl4 alone manifested (B) focal hemorrhages in the hepatic parenchyma associated with (C and D) fibrosis in the portal area and severe congestion in the portal vein. (E) Rats treated with 60 mg rebamipide/kg evidenced fibrosis in portal area with dilatation in the portal vein. (F) Rats treated with 100 mg rebamipide/kg showed only mild congestion in the portal vein at the portal area. Images shown are representative photomicrographs. Magnification in A, B and D–F = 40×; in C = 16×.
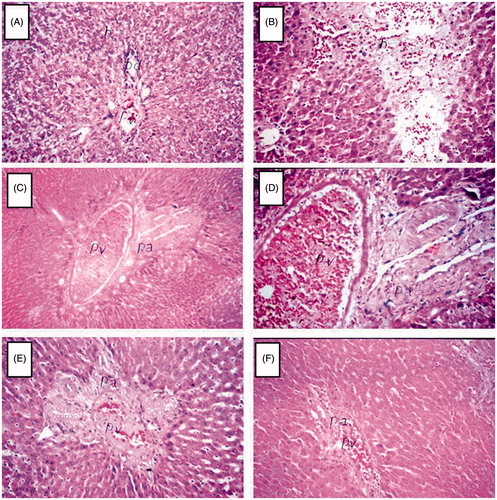
Figure 6. Effect of rebamipide on collagen precipitation in livers. Organs were recovered at necropsy and then processed and stained with Masson’s trichrome stain (MTS). (A) Normal liver tissues from control rats showed no collagen precipitation (no blue color). (B) Liver tissues from CCl4-treated rats show severe MTS-positive reaction (blue color). Tissues from (C) 60 and (D) 100 mg/kg/day rebamipide-treated rats show much less collagen precipitation compared to CCl4-only counterparts. Images shown are representative photomicrographs. Magnification = 40×.
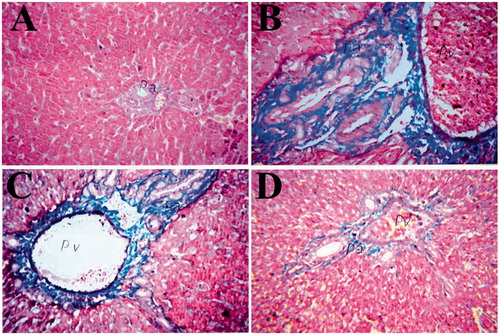
Figure 7. Effect of rebamipide on hepatic IL-10 levels. Values shown are means ± SD (n = 10/group). Value significantly different compared to a control rats or b CCl4 only-treated rats (p < 0.01).
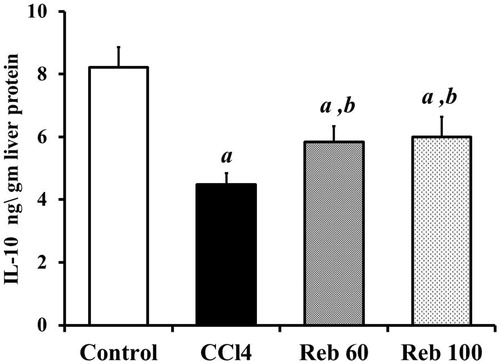
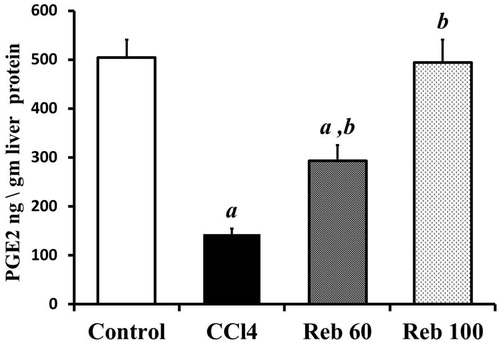
Figure 8. Effect of rebamipide on hepatic PGE2 levels. Values shown are means ± SD (n = 10/group). Value significantly different compared to a control rats or b CCl4 only-treated rats (p < 0.01).