Figures & data
Table 1. Primer sequences used for quantitative real-time PCR analysis of RNA.
Figure 1. HPLC chromatogram of triphala extract. Typical chromatogram of triphala exract prepared here. Key components were identified based on the identical retention times as those of the standards for (1) gallic, (2) ascorbic, (3) tannic, (4) chebulagic and (5) chebulic acids.
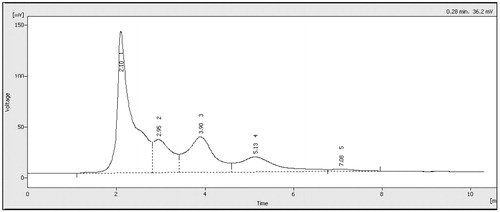
Table 2. Lysosomal enzyme release by LPS-treated RAW 264.7 macrophages.
Figure 2. Treatment effect on RAW 264.7 cell production of select inflammatory products. (A) PGE2; (B) NO. Values shown are means ± SD of data from three experiments. *Value significantly different (p < 0.05) vs all other treatment cells. Among all LPS-treated cells, values significantly different at p < 0.05: ‡vs LPS-only cells and #triphala-treated vs Indo-treated cells.
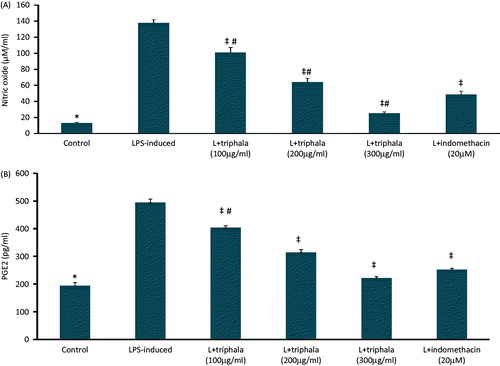
Figure 3. Treatment effect on production of select inflammatory proteins. (A) TNFα, (B) IL-1β, (C) IL-6, (D) MCP-1 and (E) VEGF. The values shown are means ± SD of data from three experiments. *Value significantly different (p < 0.05) vs all other treatment cells. Among all LPS-treated cells, values significantly different at p < 0.05: ‡vs LPS-only cells and #triphala-treated vs Indo-treated cells. Kit levels of sensitivity are provided in the Methods.
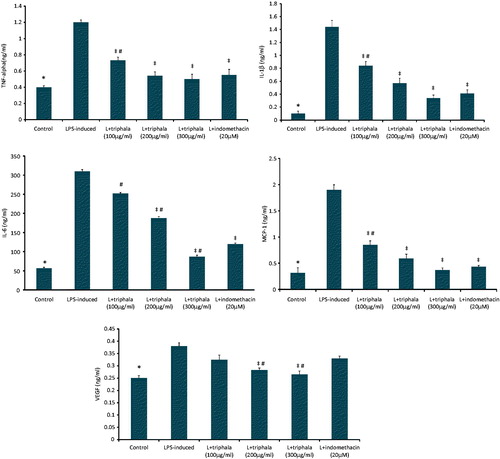
Figure 4. Treatment effect on mRNA expression levels of select inflammatory proteins, NF-κB p65 and HO-1. (A) TNFα, (B) IL-1β, (C) IL-6, (D) MCP-1, (E) iNOS, (F) COX-2, (G) NFκB-p65 and (H) HO-1. Results are expressed as fold-change from the LPS only group. RQ values are calculated relative to GAPDH gene. Results shown are ± SD of data from three experiments. *Value significantly different (p < 0.05) vs all other treatment cells. Among all LPS-treated cells, values significantly different at p < 0.05: ‡vs LPS-only cells and #triphala-treated vs Indo-treated cells.
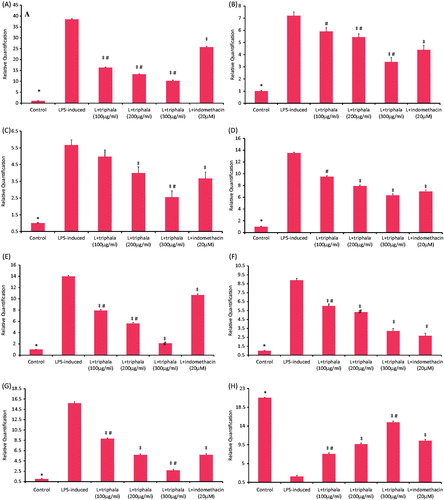
Figure 5. Treatment effect on p-NF-κB p65 nuclear translocation and COX-2 protein expression. Translocation was detected by immunofluorescence using (A) anti-p-NF-κB p65 (red) antibody or (B) anti-COX-2 (green) antibody; in each case, DAPI (blue) staining was also performed. Representative images from each treatment set are shown. Magnification = 40×.
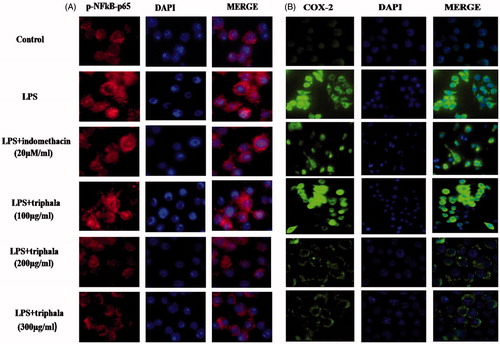
Figure 6. Treatment effect on expression of select proteins. (A) Relative expression values for NF-κB p65 and p-NF-κB p65 and for (B) IL-17, TNFα, iNOS and COX-2, all based on band intensities in Western blots. Values shown are means ± SD of data from three experiments. *Value significantly different (p < 0.05) vs all other treatment cells. Among all LPS-treated cells, values significantly different at p < 0.05: ‡vs LPS-only cells, #triphala-treated vs Indo-treated cells and @triphala-treated vs Bay-treated cells.
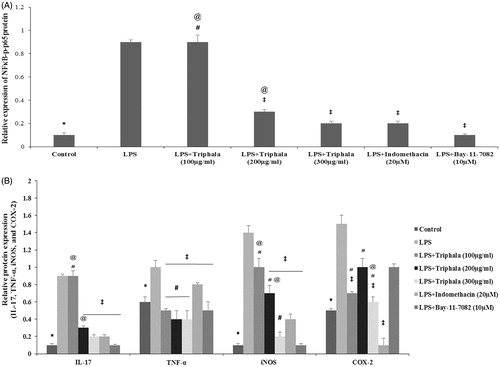
Figure 7. Treatment effect on intracellular free radical formation. (A) Fluorescence intensity units (FIU) shown are means ± SD of data from six experiments. *Value significantly different vs LPS-only treated cell and vs LPS + Indo-treated cells (p < 0.05). Among all LPS-treated cells, values significantly different at p < 0.05: ‡vs LPS-only cells and #triphala-treated vs Indo-treated cells.
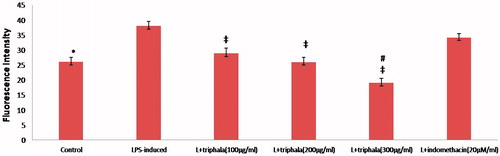
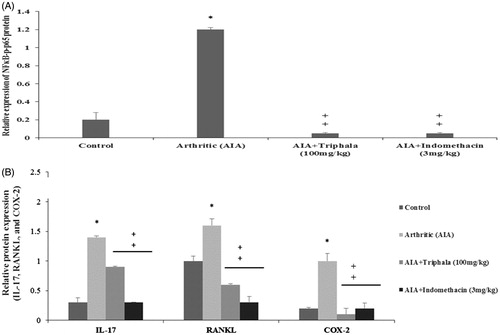
Figure 8. Treatment effect on arthritic rat paw levels of select proteins. (A) Relative expression values for NF-κB p65 and p-NF-κB p65 and for (B) IL-17, RANKL and COX-2, all based on band intensities in Western blots. Values shown are means ± SD of data from three experiments. *Value significantly different (p < 0.05) vs all other treatments. Among all AIA rats’ samples, values significantly different at p < 0.05: ‡vs AIA-only hosts and #triphala-treated vs Indo-treated hosts.