Figures & data
Figure 1. Experimental protocol. C3H/HeN mice (n = 8/group) were treated orally with either a single (dosing frequency 1×) or multiple doses (dosing frequency 7×) of DF, APAP, CMZ or OFLX. Within 24 h after the last oral dose, blood was drawn via cheek-pouch puncture. Subsequently, the animals were euthanized and the liver and spleen were removed for analysis.
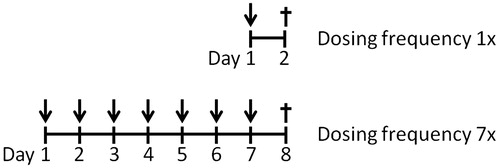
Table 1. Oral dosing scheme.
Table 2. Primer sequences.
Figure 2. Relative liver weight and liver morphology following drug exposure. C3H/HeN mice (n = 8/group) were treated orally with either a single or multiple doses of DF, APAP, CMZ or OFLX. Within 24 h following the final dose, the mice were weighed and sacrificed. The liver was isolated and weighed; a portion was fixed and embedded for morphological analysis. (A) Relative liver weight compared to body weight was determined. Vehicle- (open bars) and drug-exposed (black bars) animals. Values shown are the mean of the vehicle- or drug-exposed group ± SEM. *p < 0.05, **p < 0.01; value significantly different compared to respective vehicle-exposed group. (B–D) H&E staining performed on liver tissue of APAP- exposed mice. Portal areas (P) and central vein areas (C) are indicated.
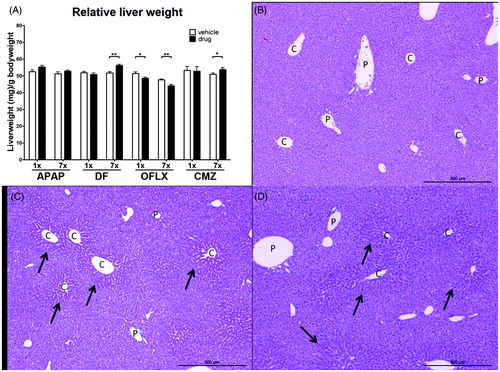
Table 3. Plasma levels of liver enzymes.
Figure 3. Relative spleen weight and cellularity. C3H/HEN mice (n = 8/group) were exposed orally to vehicle (open bars) or either a single or multiple doses of DF, APAP, CMZ or OFLX (black bars). Within 24 h following the final oral administration, the mice were euthanized and their spleens isolated. (A) Relative spleen weight compared to body weight and (B) total spleen cellularity were determined. Values shown are the mean of the vehicle- or drug-exposed group ± SEM. *p < 0.05, **p < 0.01, ***p < 0.001; value significantly different compared to vehicle controls.
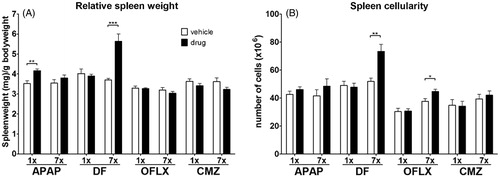
Figure 4. MIP-2 expression in spleen in lever, MIP-2 levels in serum and percentage of neutrophils in the spleen. C3H/HEN mice (n = 8/group) were treated orally with either vehicle (open bars) or a single or multiple doses of DF, APAP, CMZ or OFLX (black bars). At 17–24 h following the final dose, the mice were euthanized and parts of their (A) liver and (B) spleen were isolated and used for analysis of MIP-2 RNA expression. Values < 1 indicate decreased and those >1 indicate increased gene expression compared to controls. Values are represented as mean fold-increase [± SEM]. (C) Serum MIP-2 levels were determined using ELISA. (D) Percentages of neutrophils (Gr-1+CD11b+) in the spleen were determined using flow cytometry. Values represent the mean for the vehicle- or drug-exposed hosts ± SEM. *p < 0.05, **p < 0.01, ***p < 0.001; value significantly different compared to vehicle controls.
![Figure 4. MIP-2 expression in spleen in lever, MIP-2 levels in serum and percentage of neutrophils in the spleen. C3H/HEN mice (n = 8/group) were treated orally with either vehicle (open bars) or a single or multiple doses of DF, APAP, CMZ or OFLX (black bars). At 17–24 h following the final dose, the mice were euthanized and parts of their (A) liver and (B) spleen were isolated and used for analysis of MIP-2 RNA expression. Values < 1 indicate decreased and those >1 indicate increased gene expression compared to controls. Values are represented as mean fold-increase [± SEM]. (C) Serum MIP-2 levels were determined using ELISA. (D) Percentages of neutrophils (Gr-1+CD11b+) in the spleen were determined using flow cytometry. Values represent the mean for the vehicle- or drug-exposed hosts ± SEM. *p < 0.05, **p < 0.01, ***p < 0.001; value significantly different compared to vehicle controls.](/cms/asset/6ff98028-3289-4bae-abd9-20dcfd552f50/iimt_a_1139643_f0004_b.jpg)
Figure 5. Percentages and absolute numbers of NK cells in the spleen. C3H/HEN mice (n = 8/group) were exposed orally to either a single or multiple doses of DF, APAP, CMZ or OFLX. Within 24 h after the final oral administration, mice were euthanized and the (A) percentages and (B) absolute numbers of splenic NK cells (CD3−CD49b+) were determined by flow cytometry. Vehicle- (open bars) and drug- (black bars) exposed hosts. *p < 0.05, **p < 0.01; value significantly different compared to vehicle-exposed controls.
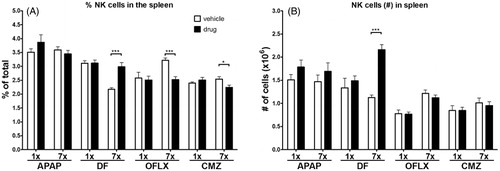
Figure 6. Percentages of CD4+ and CD8+ T-cell numbers in spleen and relative T-cell subsets. C3H/HEN mice (n = 8/group) were exposed orally to either a single or multiple doses of (A, B) APAP, (C, D) DF, (E, F) OFLX or (G, H) OFLX. Within 24 h following the final oral administration, mice were euthanized and absolute CD4+ and CD8+ T-cell numbers were determined in spleens of vehicle- (open bars) and drug- (black bars) exposed hosts. Percentages of naive (CD62L+CD44−), effector (CD62L+CD44+) and memory (CD62L−CD44+) within splenic CD4+ and CD8+ T-cells were also determined. Values represent means of the vehicle- or drug-exposed group ± SEM. *p < 0.05, **p < 0.01, ***p < 0.001; value significantly different compared to vehicle controls.
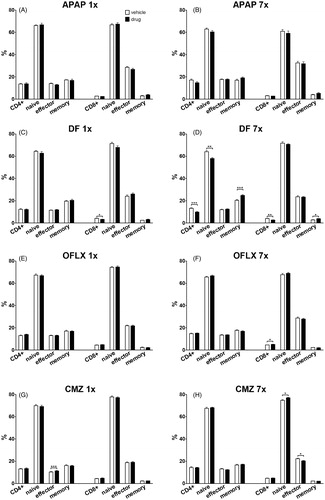
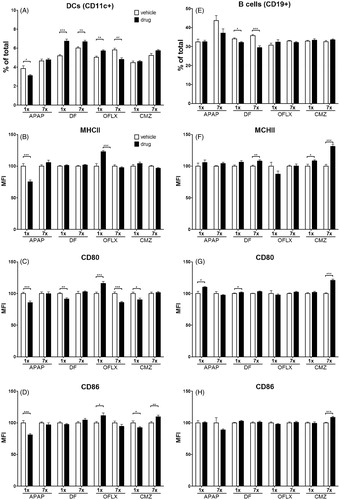
Figure 7. Expression of co-stimulatory molecules on APC. C3H/HEN mice (n = 8/group) were exposed orally to vehicle (open bars) or a single or multiple doses of DF, APAP, CMZ or OFLX (black bars). Within 24 h after the final oral administration, mice were euthanized and the percentage of (A) dendritic cells (DC; CD11c+) and (E) B-cells (CD19+) in the spleen was determined using flow cytometry. Subsequently, expression of co-stimulatory molecules MHC II, CD80 and CD86 on DC (B–D, respectively) and B-cells (F–H, respectively) was determined using the mean fluorescent intensity (MFI) compared to that by cells from vehicle-exposed controls. Values represent means of the vehicle- or drug-exposed group ± SEM. *p < 0.05, **p < 0.01, ***p < 0.001; value significantly different compared to vehicle controls.