
Figures & data
Figure 1. Chemical structure of DDAC.
Table 1. Body/organ weight of female Balb/c mice dermally exposed to DDAC.
Figure 2. Irritancy and allergic sensitization potential after dermal exposure to DDAC. (A) Irritancy and (B) allergic sensitization potential of DDAC using the LLNA. Irritancy was determined using measurements collected at 24 h following the final DDAC exposure (3 days). DPM represent [3H]-thymidine incorporation into DLN cells from the BALB/c mice following exposure to vehicle or concentration of DDAC (0.0625–1%). SI value is the stimulation index (fold-change over vehicle control). Bars represent mean (± SE) of five mice per group.
![Figure 2. Irritancy and allergic sensitization potential after dermal exposure to DDAC. (A) Irritancy and (B) allergic sensitization potential of DDAC using the LLNA. Irritancy was determined using measurements collected at 24 h following the final DDAC exposure (3 days). DPM represent [3H]-thymidine incorporation into DLN cells from the BALB/c mice following exposure to vehicle or concentration of DDAC (0.0625–1%). SI value is the stimulation index (fold-change over vehicle control). Bars represent mean (± SE) of five mice per group.](/cms/asset/75590a3b-351a-4582-9d6b-4b225a304677/iimt_a_1140854_f0002_b.jpg)
Figure 3. Local and systemic IgE levels following dermal DDAC exposure. Percentages of (A) B-cells and (B) IgE+ B-cells among total lymphocytes in the DLN and (C) total serum IgE (C) on Day 10 following 4 days of DDAC application. Bars represent mean (± SE) of five mice per group.
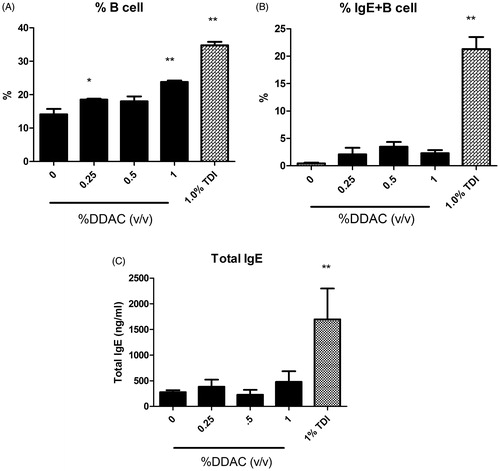
Figure 4. Increases in activated leukocytes following dermal exposure to DDAC. Percentages of (A) CD44highCD4+ cells, (B) CD44highCD8+ cells, (C) CD86+ dendritic cells and (D) CD86+ B-cells among total lymphocytes on Day 10 following 4 days of DDAC application. Bars represent mean (± SE) of five mice per group.
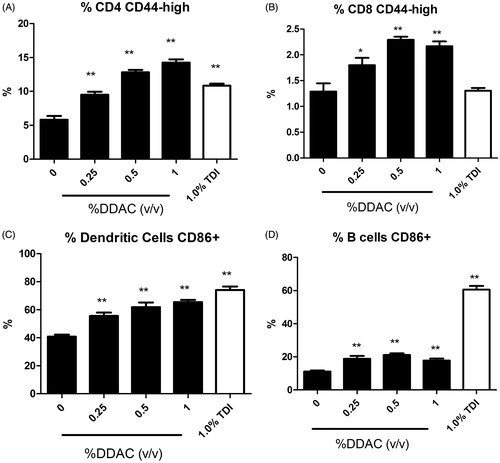
Table 2. Effects of dermal exposure to DDAC on DLN cell number and lymphocyte sub-population in female Balb/c mice.