
Figures & data
Figure 1. The plasma kallikrein–kinin system. Pathways involved in the plasma kallikrein–kinin and complement system. HMW-kininogen, high-molecular-weight kininogen; FXII, factor XII; C3, complement 3; gC1q-R, globular head receptors of isolated C1q; C1-INH, complement 1 inhibitor; B1R, bradykinin 1 receptor; B2R, bradykinin 2 receptor.
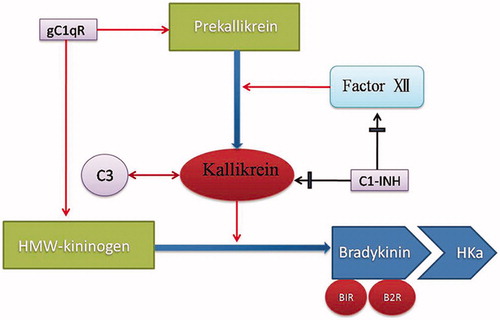
Table 1. PCR primer pairs used.
Table 2. Sensitization rates and scores.
Figure 2. Kidney histopathology. (A) Blank control; (B–E) TCE + group at 24 h, 48 h, 72 h and Day 7, respectively; (F) solvent control group; (G–J) PKSI + group at 24 h, 48 h, 72 h and Day 7, respectively. Black and yellow arrows point to cellular infiltration and tubular epithelial vacuolar degeneration, respectively. Magnification 200×; hematoxylin–eosin staining.
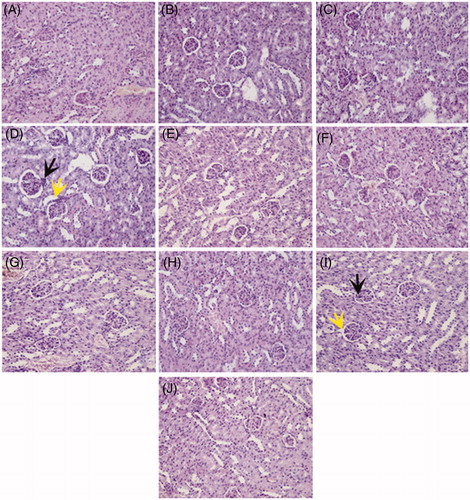
Table 3. Serum BUN and Cr in mice.
Figure 3. Plasma BK levels. Data shown are means ± SD. aValue significantly different vs solvent control group; bvs corresponding TCE- group; and cvs corresponding PKSI + group (all p < 0.05).
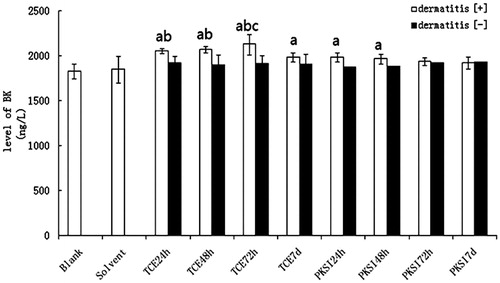
Figure 4. BK expression in kidney – by immunofluorescence [FITC]. (A) Blank control; (B–E) TCE + group at 24 h, 48 h, 72 h and Day 7, respectively; (F) solvent control group; (G–J) PKSI + group at 24 h, 48 h, 72 h and Day 7, respectively. Magnification 200×.
![Figure 4. BK expression in kidney – by immunofluorescence [FITC]. (A) Blank control; (B–E) TCE + group at 24 h, 48 h, 72 h and Day 7, respectively; (F) solvent control group; (G–J) PKSI + group at 24 h, 48 h, 72 h and Day 7, respectively. Magnification 200×.](/cms/asset/9f58fb01-f1fa-46e3-a3e3-1ead1e7b40c0/iimt_a_1142019_f0004_c.jpg)
Figure 5. PK expression in kidney – by immunofluorescence [FITC]. (A) Blank control; (B–E) TCE + group at 24 h, 48 h, 72 h and Day 7, respectively; (F) solvent control group; (G–J) PKSI + group at 24 h, 48 h, 72 h and Day 7, respectively. Magnification 200×.
![Figure 5. PK expression in kidney – by immunofluorescence [FITC]. (A) Blank control; (B–E) TCE + group at 24 h, 48 h, 72 h and Day 7, respectively; (F) solvent control group; (G–J) PKSI + group at 24 h, 48 h, 72 h and Day 7, respectively. Magnification 200×.](/cms/asset/9b59fd80-1e3e-4b1a-811e-ed236d696561/iimt_a_1142019_f0005_c.jpg)
Figure 6. RT-PCR analysis of B1R and B2R in kidney. (A and B) Data for B1R and B2R, respectively. Expression levels were normalized against GAPDH. Data shown are means ± SD. aValue significantly different vs solvent control; bvs corresponding TCE group; and cvs corresponding PKSI + group (all p < 0.05).
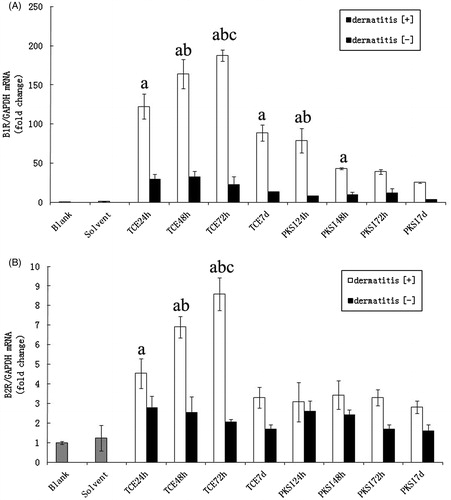
Figure 7. Western blots of kidney B1R and B2R kinin receptors. (A) B1R and B2R protein expression in the kidney detected by Western blot. (B) Quantitative data; results are expressed as ratio of B1R and B2R vs GAPDH. Data shown are means ± SD. aValue significantly different vs solvent control (p < 0.05). bValue significantly different vs corresponding PKSI + group (p < 0.05).
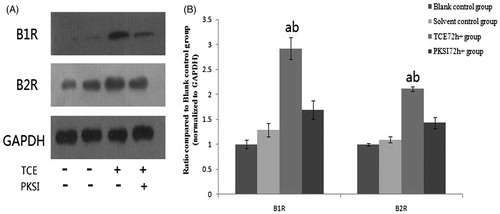
Figure 8. C5b-9 expression in kidney (immunohistochemistry). (A) Blank control group; (B–E) TCE + group at 24 r, 48 h, 72 h and Day 7, respectively; (F) solvent control group; (G–J) PKSI + group at 24 h, 48 h, 72 h and Day 7, respectively. Magnification = 400×.
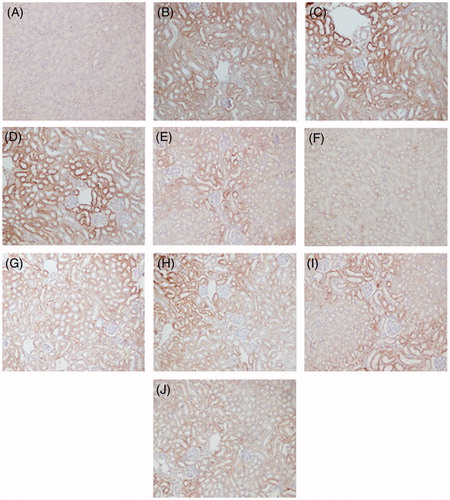
Table 4. C5b-9 deposition in renal tissue sections.