
Figures & data
Figure 1. Effect of treatments on gastric pH. Data shown are mean ± SEM (n = 8 rats/group). Value significantly different vs anormal control or bINDO only (ulcer control) (p < 0.05).
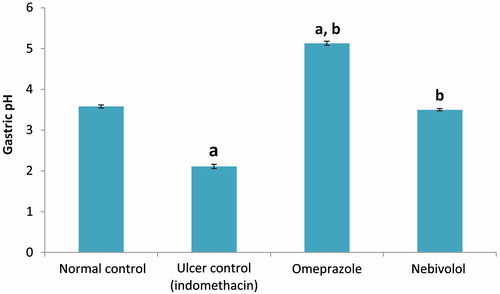
Figure 2. Effect of treatments on gastric TNFα. Data shown are mean ± SEM (n = 8 rats/group). Value significantly different vs anormal control or bINDO only (ulcer control) (p < 0.05).
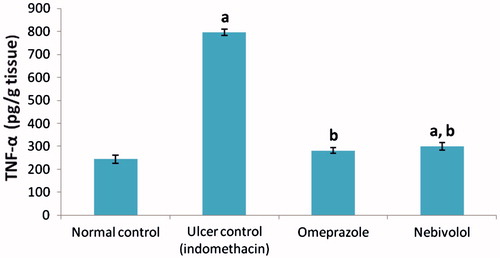
Table 1. Ulcer scores, indices and effects of drugs (preventive indices).
Figure 3. Sections of gastric mucosa of normal control rats. (a) Normal mucosal thickness with surface mucus layer covering gastric pits with intact mucosa and more gastric glands at the bottom (Magnification = 100×). (b) Parietal cells with central rounded nuclei are dispersed throughout the glands (Magnification = 400×). H&E stain. Representative images are shown.
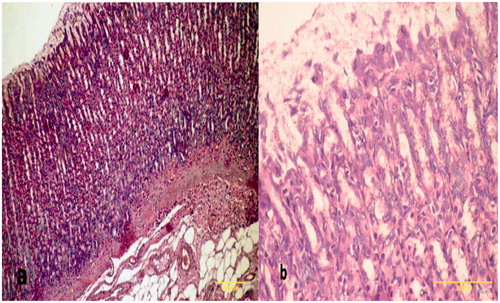
Figure 4. Sections of gastric mucosa of indomethacin-treated rats. (a) Section indicates areas of tissue damage, loss of the epithelial layer and gastric pits with decrease in mucosal thickness and distorted arrangement of glands in addition to neutrophil infiltrates in the mucosa and submucosa (Magnification = 100×). (b) Section indicates inflammatory cells (neutrophils) infiltration of the lamina propria with a loss of normal architecture of glandular cells (Magnification = 400×). H&E stain. Representative images are shown; focus was on particular lesion.
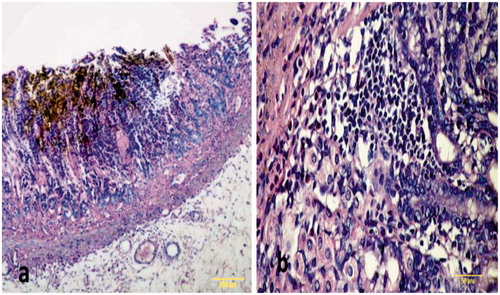
Figure 5. Sections of gastric mucosa of omeprazole-pre-treated rats. (a) Section indicates intact gastric mucosa (Magnification = 100×). (b) Gastric mucosa like normal and gastric glands with slight dilatation (Magnification = 400×). H&E stain. Representative images are shown. All of these tissues (and others from the group) were used by the pathologist to generate ulcer scores for each rat and, subsequently, the net protective index value for each group.
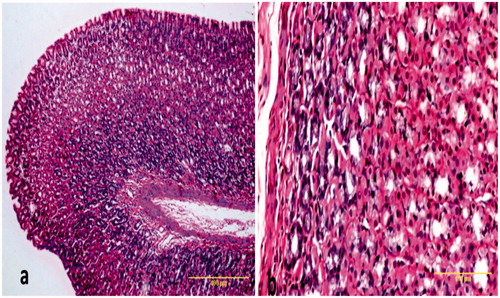
Figure 6. Sections of gastric mucosa of nebivolol pre-treated rats. (a) The section indicates ameliorated epithelial erosions by nebivolol and increase in the thickness of the mucosa compared to ulcer group with slight disturbance in the surface (Magnification = 100×). (b) The section indicates gastric mucosa with mild congestion in the connective tissue in the lamina propria (Magnification = 400×). H&E stain. Representative images are shown. All of these tissues (and others from the group) were used by the pathologist to generate ulcer scores for each rat and, subsequently, the net protective index value for each group.
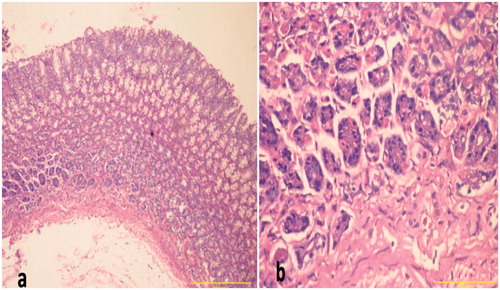
Table 2. Effects of drugs on stomach MDA and GSH levels.
Table 3. Effect of treatments on stomach cytoprotective mediators.