Figures & data
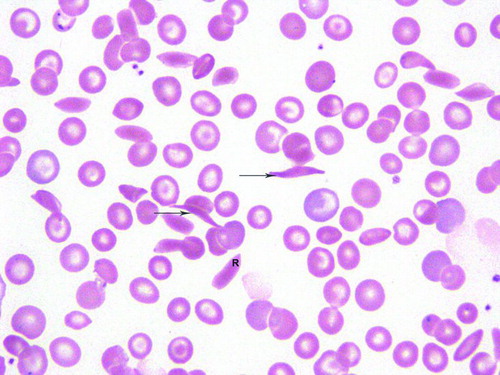
Figure 1. Peripheral blood smear depicts a reversible (R) sickled cell and two irreversible cells (arrows). There is anisocytosis and target cells.

Table 1. Sickle Index per Age Category, Genotype, and Treatment.
Register now or learn more
Open access
Figure 1. Peripheral blood smear depicts a reversible (R) sickled cell and two irreversible cells (arrows). There is anisocytosis and target cells.

Table 1. Sickle Index per Age Category, Genotype, and Treatment.
People also read lists articles that other readers of this article have read.
Recommended articles lists articles that we recommend and is powered by our AI driven recommendation engine.
Cited by lists all citing articles based on Crossref citations.
Articles with the Crossref icon will open in a new tab.