Figures & data
Table 1A. Growth of the AAPCC Population Served and Exposure Reporting (1983–2009)
Fig. 1. Human Exposure Calls, Information Calls, and Animal Exposure Calls by Day since 1 January 2000. Black lines show least-squares second order regression – both linear and second order (quadratic) terms were statistically significant for each of the 3 regressions.
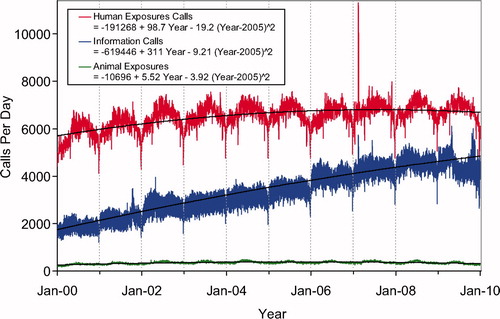
Fig. 2. All Drug Identification and Law Enforcement Drug Identification Calls by Day since 1 January 2000. Black lines show least-squares second order regression – both linear and second order (quadratic) terms were statistically significant for each of the 2 regressions.
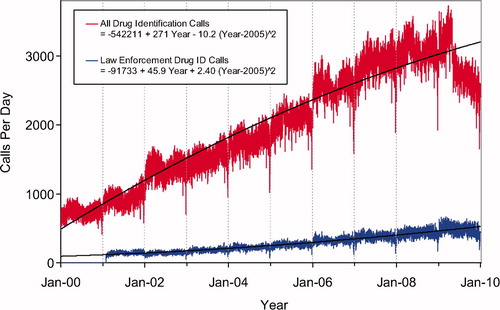
Table 1B. Non-Human Exposures by Animal Type
Table 1C. Distribution of Information Calls
Fig. 3. Health Care Facility (HCF) Exposure Calls and HCF Information Calls by Day since 1 January 2000. Black lines show least-squares first and second order regressions – linear regression for HCF Exposure Calls (second order term was not statistically significant) and second order regression for HCF Information Calls. All terms shown were statistically significant for each of the 2 regressions.
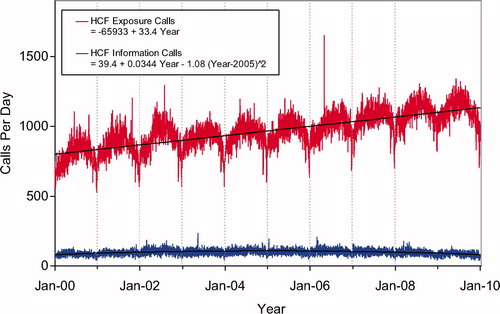
Table 2. Site of Call and Site of Exposure, Human Exposure Cases
Table 3. Age and Gender Distribution of Human Exposures
Table 4. Distribution of Agea and Gender for Fatalitiesb
Table 5. Number of Substances Involved in Human Exposure Cases
Table 6A. Reason for Human Exposure Cases
Table 6B. Scenarios for Therapeutic Errors by Agea
Table 7. Distribution of Reason for Exposure by Age
Table 8. Distribution of Reason for Exposure and Age for Fatalitiesa
Table 9. Route of Exposure for Human Exposure Cases
Table 10. Management Site of Human Exposures
Table 11. Medical Outcome of Human Exposure Cases by Patient Agea
Table 12. Medical Outcome by Reason: Human Exposuresa
Table 13. Duration of Clinical Effects by Medical Outcome
Table 14. Decontamination and Therapeutic Interventions
Table 15. Therapy Provided in Human Exposures by Age
Table 16A. Decontamination Trends (1985–2009)
Table 16B. Decontamination Trends: Total Human and Pediatric Exposures ≤5 Years (2009)a
Table 17A. Substance Categories Most Frequently Involved in Human Exposures (Top 25)
Table 17B. Substance Categories with the Greatest Rate of Exposure Increase (Top 25)
Table 17C. Substance Categories Most Frequently Involved in Pediatric (≤5 years) Exposures (Top 25)a
Table 17D. Substance Categories Most Frequently Involved in Adult (≥20 years) Exposures (Top 25)a
Table 17E. Substance Categories Most Frequently Involved in Pediatric (≤5 years) Deathsa
Table 17F. Substance Categories Most Frequently Identified in Drug Identification Calls (Top 25)
Table 18. Categories Associated with Largest Number of Fatalities (Top 25)a
Table 19A. Comparisons of Death Data (1985–2009)a
Table 19B. Comparisons of Death Data (2006–2009)a
Table 20. Frequency of Plant Exposures (Top 25)
Table 21. Listing of fatal nonpharmaceutical and pharmaceutical exposures
Table 22A. Demographic profile of SINGLE-SUBSTANCE nonpharmaceuticals exposure cases by generic category
Table 22B. Demographic profile of Single-Substance pharmaceuticals exposure cases by generic category
Fig. 4. All Information Calls, H1N1 Information Calls, CDC Influenza-Like Illness, Google H1N1 queries by Week since 6-Apr-2009. All Information Calls and All H1N1 Calls/week are shown on the left axis, patients with influenza-like illness (ILI) reported to CDC are shown on the right axis. Google Trends for H1N1 is not a scaled variable and is shown at a convenience scale.
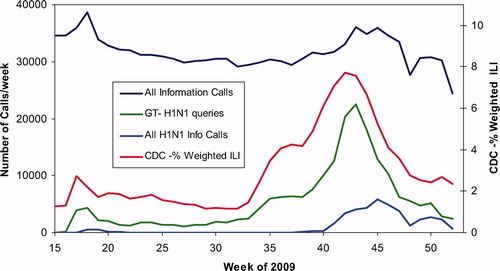
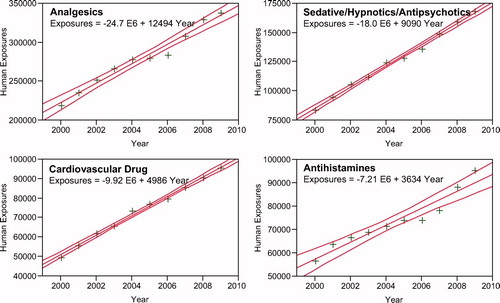
Fig. 5. Human Exposure Calls By Year 2000–2009 – Top 4 Categories. Solid lines show least-squares linear regressions for the Human Exposure Calls per year for that category (+). Broken lines show 95% confidence interval on the regression.