
Figures & data
Table 1. Selected clinical data on 39 patients exposed to aerosols from a tile-coating product containing alkylsiloxanes.
Fig. 1. Concentration- and time-dependent effects of inhaled SRS product on the tidal volume (a) and respiratory rate (b) in mice (n = 10 per exposure). Each study started with a 15-min pre-exposure baseline period, followed by a 10- to 60-min exposure period. The exposure period is followed by a 30-min recovery period. Generated concentrations are given (colour version of this figure can be found in the online version at www.informahealthcare.com/ctx).
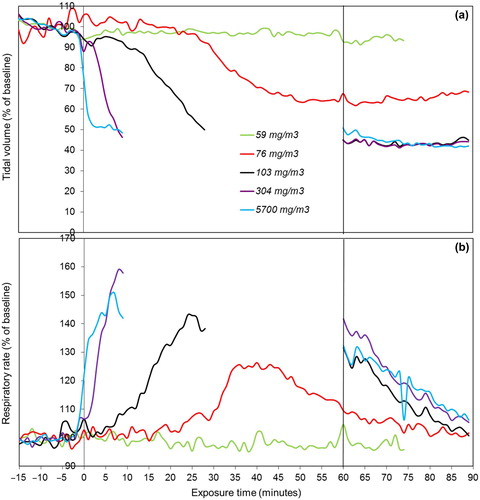
Fig. 2. Langmuir isotherms. Pulmonary surfactant incubated with either SRS product or n-decane (solvent control) is transferred to a KSV mini trough with an area of 243 cm2. A reduction of the trough area (compression of the surfactant film) results in an increase in the surface pressure (equal to a reduction of the surface tension). For simplicity and because of loss of surfactant to the subphase during the compression cycles, only the second of three compression isotherms of solvent- or SRS-incubated HL10 are presented.
Fig. 3. Total ion chromatogram showing VOCs emitted after spraying of 83.6 g SRS product at a 2 m2 surface of ceramic tiles inside a 20.3 m3 chamber. The major peaks 1 and 2 are assigned as: C9–C13 hydrocarbons (solvent) and isooctyltrimethoxy silane, respectively. Peak 3 is an unknown organosilane (colour version of this figure can be found in the online version at www.informahealthcare.com/ctx).
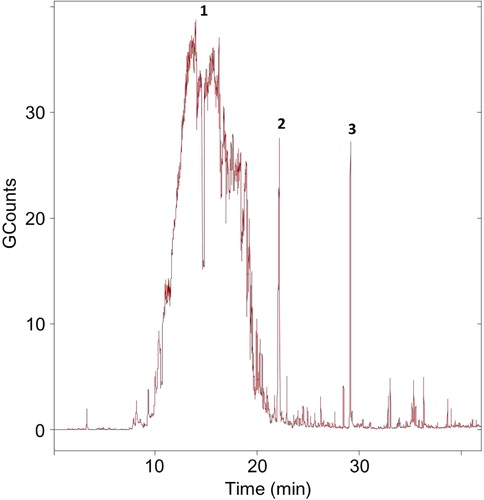
Fig. 4. Temporal evolution of particle size distributions (a) and the total particle concentration (n/cm3) over time (b) (colour version of this figure can be found in the online version at www.informahealthcare.com/ctx).
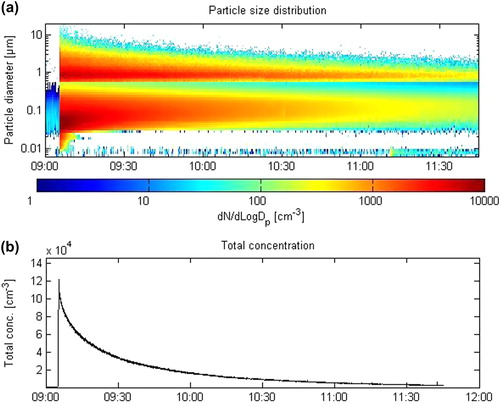
Table 2. Calculated values for alveolar deposited mass for three different exposure times.